When the Math Supports Buying Your Primary Residence Instead of Renting in 2025
February 15, 2021


This long-time Money with Katie classic has been updated for 2025 with a chapter that was originally written for Rich Girl Nation and ultimately cut in the editing phase. In the original draft of the book, Chapter 4 was called “Big, Expensive Life Milestones,” and it covered housing, marriage, and kids.
Ultimately, we decided to split marriage and kids into their own chapters and drop this one. Enjoy!
You can get your copy of Rich Girl Nation now.
Here I am again, negligently opening up the can of worms that is discussing the most emotional financial decision anyone ever makes in a country where home ownership is considered a blood oath rite of passage to adulthood and happiness. What could go wrong?
But I’m ready to invite the hordes of pitchfork-holding mortgage lovers back into my DMs once more, because today, we’re talking about when the math supports buying instead of renting. (The TL;DR: It’s not as often as you’d think. I think this post will bring you to my dark side, because it allows you to live in your cake and invest it, too.)
Of course, this is a debate that’s heavily skewed in favor of home ownership in the US. And when the media publish headlines like this one—noting how homeowners’ net worths are “40x greater” than that of renters—it’s easy to get the causality backwards. Being the owner of your primary residence does not make you a rich person, but a rich person is probably more likely to buy their primary residence.
A brief back story: My first disillusioned attempt at buying real estate
When I was 22, I signed my first lease on my own. Until that point, I had lived under my parents’ roof (or in a roof they provided; shout-out to Chris and Mary for 21 years of shelter). With every passing first-of-the-month, I’d grimace as $882.50 plus $3.50 in “processing fees” exited my checking account stage left. After only a few months as a renter and with very little savings under my belt, I decided—inexplicably—that it was time to buy a condo. (This was 2017, when the idea of buying your home didn’t inspire cold sweats and a thousand millennial thinkpieces like it does today.)
Since I had approximately no idea what I was doing, I asked my parents for advice about where to start. In retrospect, their response was quaint: “Um, with what money?” But I explained my master plan: If I were going to spend $882.50 every month on rent for the next 10 years, I was going to waste $105,900! This wasn’t financially prudent, I thought, and I began convincing them that since I didn’t have $25,000 for a 10% down payment on a $250,000 condo, they should lend me $25,000. While they pretended to mull it over, I began working with a real estate agent and her recommended lender. I toured dozens of ramshackle, two-bedroom condos all over Dallas, and was horrified to learn that—for $250,000—I wasn’t going to get wood floors and gorgeous views. “This place’s bathroom just needs a little work,” my agent told me one morning as she swung open a faded door to reveal bright purple tile and hardware that looked older than me. “But that’s an easy $15,000 fix.”
I did some quick math on my purchase budget which was, for all intents and purposes, determined based on nothing beyond it being a round number that sounded reasonable. If I put $25,000 (of my parents’ money) down, my monthly payment would be $1,073. How manageable! I thought. Barely more than rent! After one Friday afternoon tour, my agent dropped a folder onto the kitchen island and its contents revealed a world of tough adult lessons in one fell swoop. She had prepared an example breakdown of costs, probably in an attempt to get me to fish or cut bait. “So with this place, you’d be a little over budget, but your mortgage payment would probably be around $1,200. Then you can assume around $420 per month in property taxes, another $100 or so in insurance…and you’ll just need about $10,000 at closing.” The numbers swirled around and collided with one another in my mind’s eye. “Wait,” I told her, “I’d be putting down $25,000.” (Mary and Chris hadn’t yet dropped the bomb that they would not, in fact, be handing me a few dozen Gs for my hot condo scheme.) “I know,” she replied, “The $10,000 is additional. It’s for your closing costs.” *brakes screeching*
$1,073 looked quite a bit different from “an extra $10,000 at closing and nearly $1,800 per month.” I figured I could get a roommate to help defray the costs, but still—I didn’t particularly like the places I was seeing. Was I really about to risk more than half of my take-home pay for this? (In retrospect, I probably could’ve risked it and been fine—knowing what we do now about appreciation in Dallas and interest rates, it would’ve become a hot little rental property. C’est la vie.)
At the end of the day, my brilliant real estate play was for naught because…well, I didn’t have any money. But in the years since, I’ve accumulated quite a bit. So why haven’t I bought a home? The Williams-Sonoma-branded elephant lounging in the corner of the room when we discuss things like our eventual face-melting retirement is the fact that there are a few major life milestones that often come long before financial freedom does if you’re going to take up these various financial gauntlets. We’ll start with an especially relevant one in the 2020s: buying a home, and the self-explanatory financial beatdown that ensues. This type of major life decision probably requires quite a bit of planning (unless you’re an heir to the Blackstone single-family housing team’s fortune, in which case, my Venmo is @katie-gatti—pitch in).
Buying a home in the US is culturally sacrosanct, which makes it difficult to see the decision clearly
The tough part about this outlandishly expensive milestone is that it’s changed a lot over the last few decades, and as a result, the way we approach it has to change, too. Home ownership has long been considered the “best” way to build wealth in the US—because until relatively recently, low-cost, diversified access to public markets didn’t really exist. The only asset people could realistically buy was the structure they lived in. But today, you can buy a share of an S&P 500 index fund in three minutes flat for as little as a few dollars using the supercomputer you carry around with you all day.
Because the unfortunate reality of the 2020s is, the more you pay for a home and the higher the interest rate, the longer you must live there in order to break even. Renting, of course, will always be a “net loss” of funds through that lens, but one that can be offset by investing your monthly cost difference in something else, like the stock market. It’s worth calling this out explicitly because while we all tend to agree that renting is sheerly an expense that won’t bear financial fruit, we don’t tend to think of ownership in the same way. The assumption is that owning (under almost any circumstances) will be financially beneficial, and this leads us to downplay or ignore the costs we’ll almost certainly incur along the way.
The opportunity to get effortlessly better returns somewhere other than your housing structure has changed the calculus dramatically—and unlike the way gender or race can impact housing transactions and appreciation, the share price of the S&P 500 is the same for everyone, everywhere. It’s a truly egalitarian, gender-blind, race-blind means of building wealth.
The fraught history of housing (and why home ownership can net different results for single women and people of color)
People who aren’t white men have had a historically fraught relationship with home ownership in the US. Banks could legally refuse to loan money to women on the basis of their sex and marital status until just 50 years ago in 1974 when the Equal Credit Opportunity Act passed. For this reason, I feel a little funny about the way we often nostalgically romanticize the post-WWII economy—sure, the economy was strong and homes were affordable, but we often forget that single women and people of color weren’t really included in that middle class, and the married women who were included didn’t actually have a right to the wealth being created. This is why it’s all the more impressive that single women homeowners outnumber single men (though it’s likely due more to women outliving their male partners than having a ton of economic power; a win is a win).
But the primary way a house is thought to build wealth for its inhabitants rests on the idea that a home will “appreciate”—that its value will rise. Oftentimes we treat real estate appreciation as though it’s a scientific fact of nature, like gravity. Own a home, watch it go up in value, cash out. It’s hard to overstate just how crucial this “appreciation” is for ownership to make financial sense: A report from the National Association of Realtors examined the housing market between 2011 and 2021 and found that price appreciation accounted for roughly 86% of the wealth associated with ownership, meaning nearly all of the gains came not from actually paying down a mortgage, but from matters mostly outside the owner’s direct control. Housing policy expert Jerusalem Demsas puts a finer point on this finding in The Atlantic: “This is a key, uncomfortable point: Home values, which purportedly built the middle class, are predicated not on sweat equity or hard work but on luck. Home values are mostly about the value of land, not the structure itself, and the value of the land is largely driven by labor markets.”
As such, appreciation is vulnerable to an overwhelming number of factors, particularly when one considers the observable differences in how the people who live in and around the home influence its market rate. Far from being a fixed value impervious to bias of prospective owners, Yale Insights found that—when compared to single men—single women spend about 2% more when they buy a house and end up getting an average of 2% less when they sell, resulting in returns that are roughly 1.5% lower per year.
The researchers pointed out that in similar experiments where men and women used identical scripts in negotiations (though in car dealerships, not real estate transactions), the men were more likely to receive the discount they were asking for. And since a home purchase is often leveraged by 5x or more (that is, you put 20% down and borrow the other 80%, therefore magnifying your gains or losses accordingly), the gap is amplified to more than 7%. If this statistic feels dubious based on a factor like gender alone, consider the way this has been true on the basis of race. Redlining, the discriminatory practice that prevented Black Americans from owning homes in the same areas that white Americans lived in the 1940s and 1950s, blocked them from receiving financing or introduced restrictive covenants that prevented them from obtaining a deed at all. Research suggests that Black Americans still don’t benefit from home ownership in the same way white Americans do. Since the 1980s, homes in white neighborhoods have appreciated at approximately twice the rate on average than those in communities of color.
It’s hard to believe that the demographics of the owner could influence something that seems as sterile and straightforward as the market value of a home, but the research would suggest the relationship exists: Goldsmith-Pinkham and Shue, the researchers behind the Yale paper, analyzed more than 50 million housing transactions from across the U.S. between 1991 and 2017 in order to generate their findings of the consistent 2% gender gap in value, and explored many hypotheses that might explain it, including the idea that perhaps single men were more likely to buy fixer-uppers and invest sweat equity: They were unable to identify any evidence of such a phenomenon: “While modest DIY work might not show clearly in the data, there was no evidence of greater levels of investment in maintenance or significant renovation by single men.”
In this way, claims that real estate “always appreciates” or is a unilaterally great way to build wealth remind me a little of the way most medical research was conducted and based on the male body and doesn’t necessarily translate. Might those findings still hold true for a woman? Perhaps—but it’s almost certainly deserving of a closer look, because getting this decision right can have a major impact on a woman’s long-term financial outcomes.
Why you should beware the recency bias of a hot market when buying a home in 2025
Between the end of WWII until the early aughts, US home prices appreciated by just 0.32% per year after inflation. In fact, practically all of the “real” growth in the housing index happened in the last couple of years. The 3-year annualized returns are an ahistorical 11.49%. If you bought in 2020 with a sub-3% interest rate right before prices exploded, you’d be forgiven for assuming you made the deal of your lifetime (because you did). Similarly, if you bought your first home in Palo Alto in the 1970s for a pile of gum wrappers and an expired Big Boy gift card and now it’s worth $2 million, you’d also be forgiven for assuming that home ownership was your ticket to wealth (because it was).
Black Knight, a company that collects data for mortgage, real estate, and capital markets, found that the “national payment-to-income ratio”—that is, the share of the median income that’s needed to make the monthly payments on the average priced home with 20% down—is approaching 40% today, up from around 25% just 30 years ago. With the exception of a brief period of high inflation in the early 1980s, it’s never been more expensive than it is today to own your home. To put a finer point on it, in 2022, the average income for one earner was $61,565 (per US Census Bureau data across all 50 states) and the overall median household income was $74,580 (per FRED). In order to meet the lending qualifications to “afford” the median home ($416,000 per FRED) in 2023, a household would need to earn about $96,000 per year. Getting a loan to buy the median home is not possible on the median income, as lending restrictions would prohibit it. All this translates to mean that homes today are between 1.5x and twice as expensive, in real terms, than they were in the 1990s, and as we noted, the vast majority of that real growth occurred in just the last few years—which has interesting implications for the other ways you can consume housing; namely, by renting it.
How the price-to-rent ratio can help you choose housing strategically
Everyone has to pay for shelter in some way, and when you’re consuming a place to live, you get two options: You can pay someone else to use their structure, or you can purchase your own structure by way of renting it from the bank for the first ~30 years you live in it (unless you have enough cash to plunk down and buy it outright, in which case you’re mostly just on the hook to rent the land from the state in the form of your property tax bill). Can you tell I’m skeptical of the concept? Don’t worry, I’ll still give it a fair shake—it can be the best decision financially despite its flaws, so we’ll break down how to figure it out for yourself.
The price-to-rent ratio tells us the relative premium you’d pay to own a home in a given area vs. renting a comparable home in that same area. You can find it by dividing the median home value in a location by the median cost of one year of renting in the same location. The price-to-rent ratio is, in my mind, the most valuable metric that can lend some sanity to a decision that has a tendency to become emotional quickly. Generally speaking, a price-to-rent ratio of 15 or less means it’s going to be net-cheaper to own your home than rent it. A price-to-rent ratio of 21 or higher means it’s likely you’ll be better off financially by renting and investing the difference. Those 6 points in between? That’s more of a gray area.
It’s generally cheaper in 71% of US cities right now to rent than buy, given current median home values and rents. How could this be possible, when conventional wisdom tells us it’s always more financially prudent to own your home? For example, the price-to-rent ratio in New York City is 26 as of 2023, which functionally means the price of the median home costs roughly the same as 26 years of today’s rent. If that sounds unbelievable to you, take a trip with me to the west coast, where the price-to-rent ratio in San Francisco, California is a bewildering 38—meaning it costs roughly 38 years of rent to pay for a home outright (and it’s probably worth highlighting that this is before the cost of mortgage interest, taxes, or insurance).
Compare these cities—where it almost certainly doesn’t make financial sense to buy today unless money is not a concern in your decision—with a place like Baltimore, where the price-to-rent ratio is 13. According to SoFi, here’s how the price-to-rent ratios for 52 major US cities stack up as of 2023 (the middle horizontal axis is 20, above which it’s likely cheaper to rent, and below which it’s likely cheaper to buy):
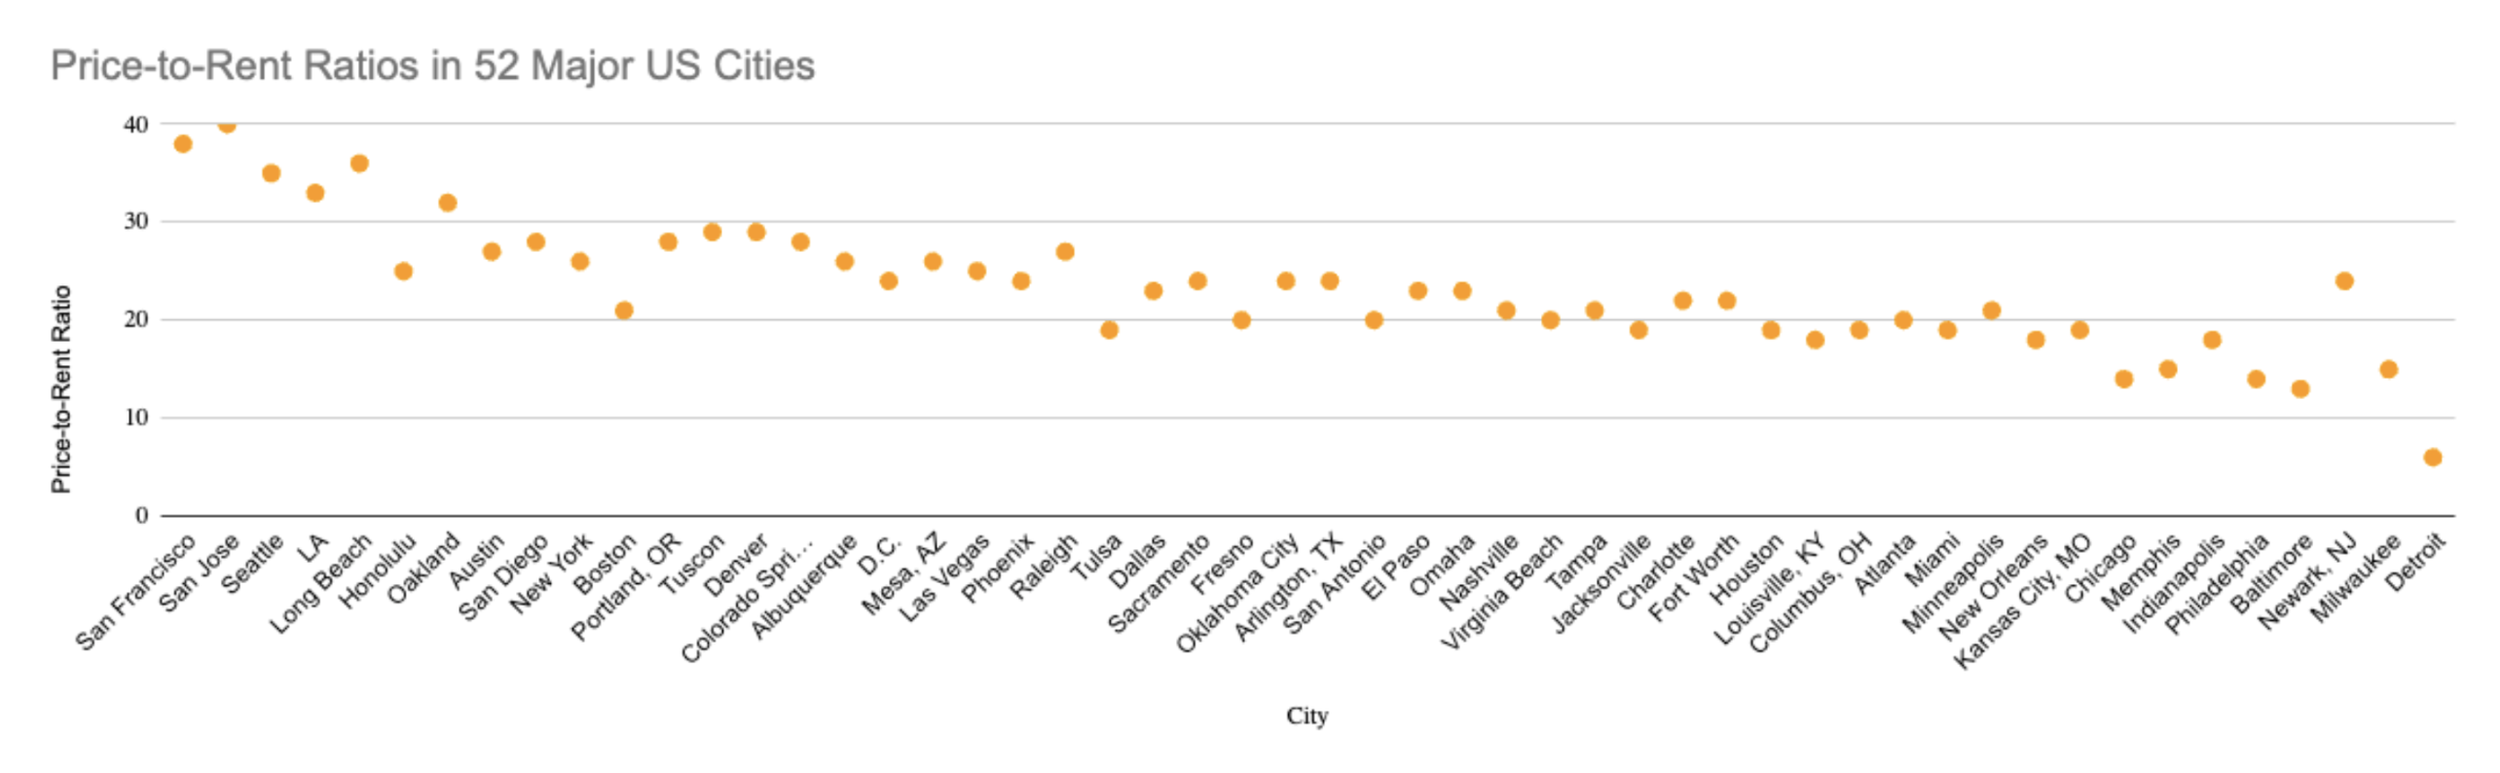
As you may be able to deduce visually, roughly 15 of the major US cities shown here have price-to-rent ratios below 20, while 37 are above 20.
The reason the price-to-rent ratio is so fabulous is because it’s reflective of the near-real-time state of the market, not based on historical fantasies about buying a brownstone in Brooklyn before it was cool.
The total cost of ownership: Let’s buy a house together
In order to fully understand the cost of homeownership today, we have to take a step back and look at the full picture. Because the average American family lives in their home for 13 years (rather than for the full duration of a 15- or 30-year mortgage), we’ll use 13 years as our timeline (this average has increased from 8 years in 2010). In 2023, the median home value in the US was $416,000, according to BankRate. We’ll round up to an even $500,000, partially for the sake of easy math, and partially because I haven’t lived somewhere where you can get a decent home for $416,000 since I grew up in Northern Kentucky, a glorious low cost-of-living mecca known for affordable housing and an Amazon warehouse.
A $500,000 home would suggest a $100,000 down payment (20% of its total value) to avoid mortgage insurance, which means you’d mortgage the other $400,000. Keep that in mind for later. (And if you’re sitting there like, “But Katie, you don’t have to put 20% down!” You’re right. But the more we mortgage, the more interest we pay, and we’ll pay an additional insurance fee for the pleasure of mortgaging more than 80%. In order to keep our unrecoverable monthly costs relatively reasonable in this example, I’m going to assume 20%.)
A note on sub-20% down payments
This isn’t a decision to squeak your way into with as little cash as possible. If your PMI payments are small and will fall off once your equity eclipses 22%, it might be worthwhile if done purposely, but I’ll draw one line in the sand here: Putting down less than 20% because you want less equity (and therefore, to pay less of an opportunity cost by locking up your down payment in an illiquid asset) is a very different decision than putting down 5% because it’s all you can afford. The former is strategic; the latter means you’re one HVAC issue away from total financial ruin, which is a level of stress and anxiety I wouldn’t wish on anyone. If you’re stretched extremely thin by the purchase of your home, you’re rushing it.
Paying for all the extras
Between taxes, insurance, and maintenance on our home, we can expect to pay between 3% and 5% of the property value each year on costs extraneous to our monthly payments. We’ll ease into our expenses. For starters, we have to insure the home. The national average cost of homeowners insurance is between 0.5–0.9% of the total property value per year, so we’ll pick 0.6% on the lower end. Assuming our home appreciates by the national average of 3.7% per year and we bump up our insurance accordingly, our insurance premiums over the course of the 13 years we live in the home will cost a total of $48,948.
I calculated this number by determining the annual increase in the value of the home and multiplying the home’s new value by .6% per year to determine the annual cost of insurance, though that may be a tad conservative—I don’t think most people bump up their coverage in real time in that way, but we’ll play ball today since we’re choosing a number on the lower end of average.
Next, let’s talk about property taxes—because this can make or break our calculations. Depending on where you live, this can be reasonable or a total nonstarter. The annual national average is about 1%. Assuming our 1% property taxes are recalculated by the county every year and our home is appreciating by the average of 3.7% per year…carry the 1…we’ll pay $81,581 in property taxes over the 13 years we live in the home. (Though note every county reassesses on a different timeline, and it’s a bit of a suburban pastime to protest your property tax bill increases.)
Now’s probably a good time to state the obvious: This is why buying more “house” than you can comfortably afford sucks the life force out of your finances. It’s not just the home itself that’s more expensive upfront and every month thereafter, but all the “add-ons” cost more, too, because they’re all proportional to the overall tax-assessed value of your property.
So let’s pause for a moment: Between insurance and property taxes, we’re looking at $130,529 over 13 years (or $10,040 per year, or $836 each month) in addition to the cost that we’re putting into owning the home, like the actual mortgage and interest on the loan. Taxes and insurance are just the small waffle fries on the side of your spicy chicken sandwich, and they’re waffle fries that cost about $10,000 per year on a $500,000 chicken sandwich, or roughly 2% of the property value each year.
We find other ways when faced with these bills to scrape together the additional metaphoric $10,000+ per year, like skipping vacations or cutting back on other savings, but we can plan for them, because we know we’re going to have to insure and pay taxes on our home. It’s not a surprise, it’s just not often discussed when we’re being encouraged by everyone from our dad to our nosy coworker to “stop throwing money away on rent.” Now, if your home is reliably appreciating by, say, 10% per year, you’re probably not sweating an extraneous 2%. But what if it’s not? Let’s continue.
Before we get to the chicken sandwich, let’s talk about maintenance and repairs, which are perhaps the most overlooked element of transitioning from tenant to your own personal landlord. Anne Helen Petersen captured this well in her hilariously named piece “How Your House Makes You Miserable.” “If you think about it, houses are incredibly vulnerable: to the elements, to their age, to negligence, to animals and kids and pests and water and mold. They are complicated and secretive; the people who originally designed, built, and modified them are often not the people currently dealing with them. What I would give to talk to the person who plumbed that downstairs bathroom! I break my house just as often as the weather does.” Because we know hot water heaters will break, pool filters will go bunk, and 16-year-old student drivers may plow through your front windows, real estate agents often recommend setting aside between 1–3% of a home’s value per year for maintenance, depending on how old the house is. Conservatively, if we choose the lower end of the spectrum with 1% in maintenance costs per year on average over the 13 years we live there, that’s an additional $65,000 in maintenance and repair costs. (Even if we escape disaster for a few years, it’s good to hang onto that “house emergency fund” to tap in the future—you never know when the foundation will start sinking, and unfortunately, we can’t really plan for it beyond knowing it’s a possibility.)
I’m not adjusting this one upward for appreciation, though I probably should—since technically homes “depreciate” over time (as in, they get progressively shittier and more outdated, requiring more investment to maintain). If we’re being really pedantic, it’s not your home that’s becoming more valuable—it’s the land your house sits on, as mentioned earlier in this chapter. This is why the government allows real estate investors to write off “depreciation” on their properties, because even the Tax Man knows your house is getting worse and requires you to spend more money to keep it liveable and up to date.
If we want to do the fun and sexy stuff like kitchen remodels and installing bouncy castles in the basement, that’s a separate expense. The routine maintenance and repairs we’re talking about (pipes bursting, sprinkler systems breaking, washer/dryer sets crapping out, accidentally flushing a dog toy down the toilet and replacing a septic system) are usually unavoidable.
We’re up to $195,529 on the upkeep, taxes, and insurance for our $500,000 home over the 13 years we live in it, or $15,040 per year in addition to our mortgage and interest, on average (bumping our “2% of the property value in extra costs each year” up to 3%). That’s an average monthly cost of roughly $1,253 toward what we can call “unrecoverable costs,” or costs that do not build any equity in the same way that rent builds no equity.
I don’t think I’d feel as harshly toward ownership if it were discussed in the same plain, unromantic terms that renting is, but it seems to me that we often only see the rosy, white picket fence view of home ownership full of catered house-warming parties and custom drapery. We don’t often get the follow-up picture of frantically calling an older, richer relative because an unexpected five-figure repair came out of nowhere.
But wait, what about our mortgage payments?
Finally, it’s time to talk about principal and interest. Here’s where shit takes a dark turn in 2023. This is a pretty simple calculation, so let’s assign the new national average interest rate. According to BankRate, as of September 2023, the average U.S. mortgage rate for a 30-year fixed mortgage was 7.59%. This factor will seriously impact these numbers as you run them for yourself, so I suggest using the rates you’re actually pre-approved for.
As a refresher, we’re mortgaging $400,000 after putting $100,000 down. Our principal and interest payment every month is a fixed $2,822. To be fair, this monthly payment is probably the strongest argument for buying a home: You lock in a fixed payment for the duration of your loan, and in periods of high inflation, your debt benefits from the tailwind of being more or less “inflated away.” Owning is a good inflation hedge. When we run the numbers for this scenario, we know without a shadow of a doubt what we’ll pay (toward our mortgage and interest) each month in one year from now and 13 years from now. It doesn’t change, as our rent is subject to.
But as you’ve likely deduced by now, that $2,822/month doesn’t tell the whole story. Our monthly mortgage payment of $2,822 is complemented by our average $1,253 in insurance, taxes, and routine maintenance, for a grand total of $4,075 per month. Now, we’re only living in this home for 13 years before selling.
If we’re spending $2,822 on our mortgage payments each month for 13 years, that’s a total cash outlay of $440,232 in principal and interest payments. If you’re like me, you’re probably like, Wait a second, that’s nearly $500 Gs! Does this mean I’ve almost paid off the home?! In a 7% rate environment, nowhere close. Are your tissues ready?
Over the full 30-year term, a $400,000 mortgage would cost a grand total of $1,015,758 with a 7.59% fixed rate, $615,758 of which represents interest payments alone. But that’s over the full 30 years, and we’re selling the home after only 13. This means we’re paying majority interest for the entirety of the time we live in the house. By year 13, after more than $440,000 in payments on our $400,000 loan, we’ve only paid off $76,380 of the principal. We still owe $323,609.
Let me repeat that for dramatic effect, because what the actual white picket fence: When we sell after 13 years, we’ll have paid (conservatively!) $195,000 in taxes, insurance, and maintenance, as well as $440,000 to the bank, but have only gained $76,000 in equity (before appreciation, which we’ll get to shortly). And of course, we can’t forget our original down payment of $100,000. Home equity is expensive.
In total, this means our cash outlay—the total amount we’ve paid for this home over 13 years—was $735,000 ($100,000 down payment, $440,000 in payments, and $195,000 in extraneous costs). We still need to pay back our $323,609 loan. So unless the home we purchased for $500,000 has appreciated to at least roughly $1,100,000, not only have we not made any money, but we may have actually lost money. (Because we need $1,058,609 to break even.) Our home would need to appreciate by an average of 6.253% every year to break even upon selling in year 13. And while we could refinance if rates were lower in the future, that’s not always a silver bullet: We’d have to pay closing costs again upon refinancing, which are typically between 3% and 6% of the loan’s value. Refinancing also means the loan amortization restarts, which means majority-interest payments again. If we intended to stay in this house forever, it would likely eventually pay off. But after just 13 years? If we assume we’re able to sell for $1.1 million after 13 years and pay a 5% broker fee for the honor of doing so, we’d “make” $1,045,000 on the sale—of which $323,000 will pay back the bank, and the remaining $722,000 will feel like money in our pocket. But remember, over the last 13 years, we’ve spent $735,000 to live in it.
Our profit on a home we bought for $500,000 and sold for $1.1M 13 years later is negative $13,000. Even in this extraordinary housing market where our home more than doubled in value, we’re essentially walking away with slightly less than we’ve spent over the previous 13 years. But of course, we’re going to feel as though we’ve cleaned up: After paying back the loan, we’ve got more than $700,000 in hand! If we originally purchased the home for $500,000, we’re going to feel as though we profited $200,000 on that transaction. It’s at this point that I could yell pencils down and declare home ownership a gnarly ruse, but we have to remember the alternative: 13 years of rent represents a net loss, too. If we had rented for all 13 years, we would’ve spent a lot more than $13,000 on shelter—so theoretically, we’re still ahead as homeowners. This is where we have to consider one last very important factor known as opportunity cost. This is where the price-to-rent ratio can guide our choice, because we have other options to build wealth in the 21st century unlocked by cheap, easy access to public markets.
When you consider our original $100,000 that was locked up right away combined with the fact that renting is net-cheaper than owning in 71% of US cities today, this calculation gets even more interesting. Had we invested our $100,000 down payment in the stock market instead and gotten the historically average 9% annualized return before inflation, we’d have roughly $306,580 to show for it at the end of year 13.
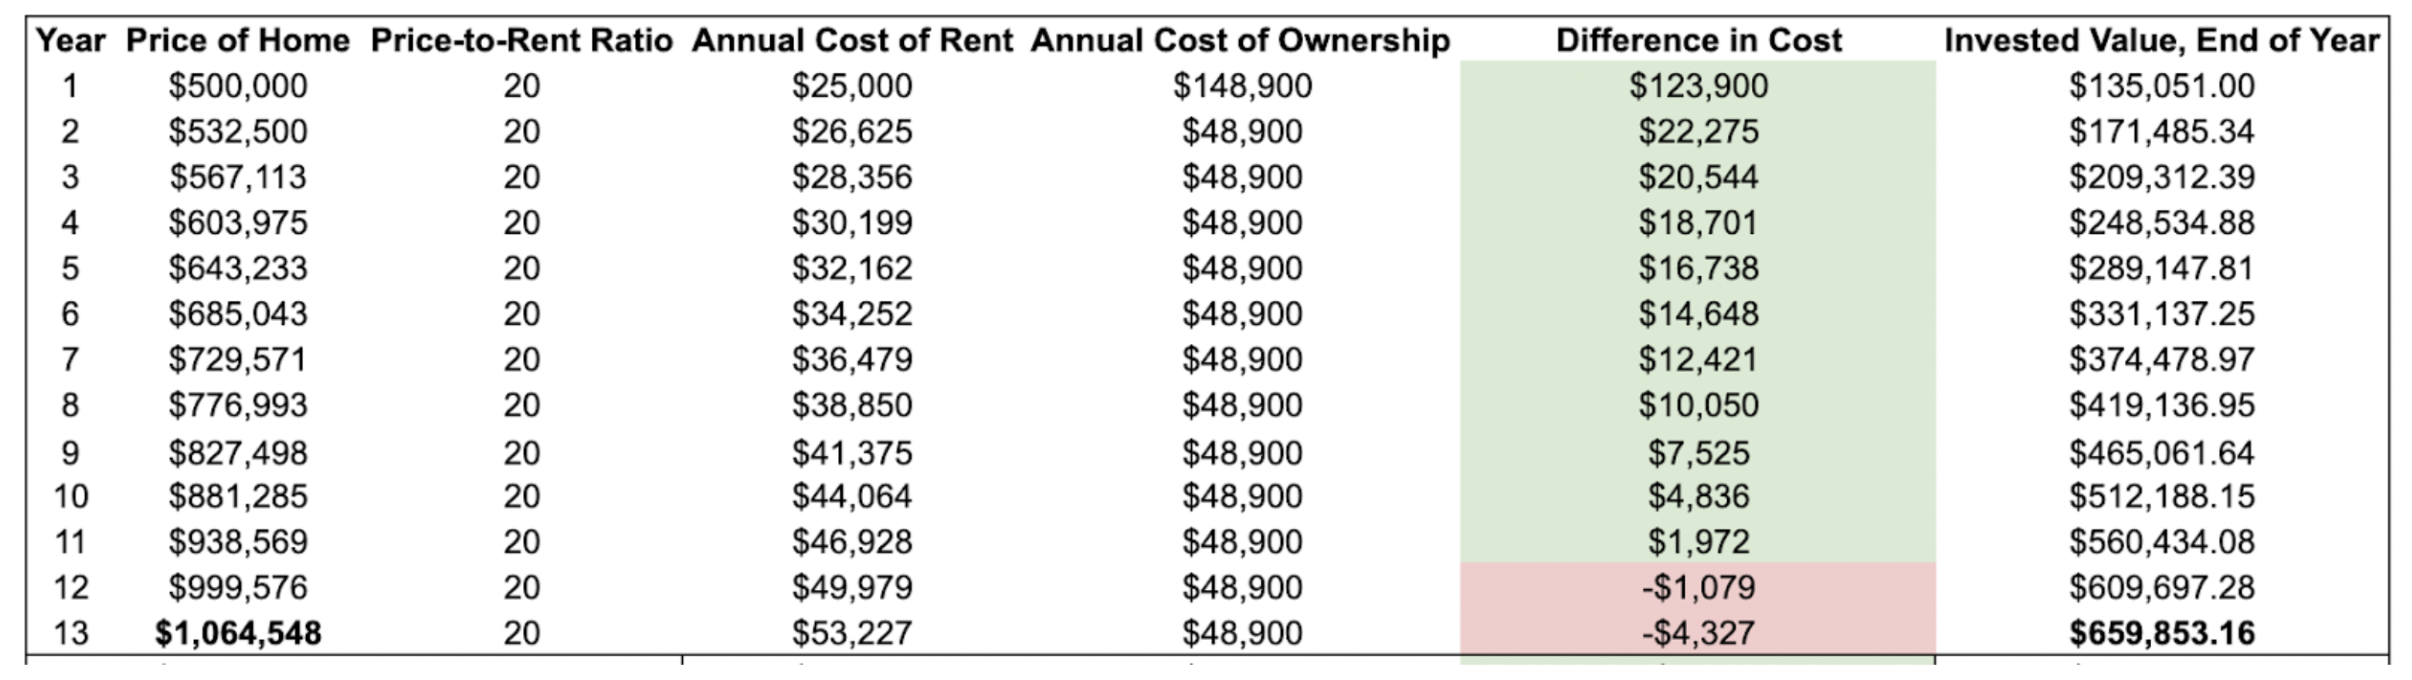
We spent an average of $4,075 per month for all 13 years as owners, right? So as long as renting cost less than that each month and we invested the difference, we would’ve fared even better as renters. If we assume an area where the price-to-rent ratio is a middle-of-the-road “20,” we can start to nail down the likely opportunity cost over time. And because anyone who’s rented for a long time knows that rent changes over time, we’ll assume it rises consistently with the value of the home (which is technically unrealistic, since that’s not how rental markets work, but we’ll hold our price-to-rent ratio of 20 constant as our home in an area of extreme appreciation gains 6.5% per year on average, before inflation).
The net cost of rent rises every year while the cost of ownership stays constant—but it’s not until year 12 that the rent rises to the point where it eclipses the annual cost of ownership, presenting us with an opportunity to invest our initial down payment and the difference in costs each month into the stock market for 12 years…
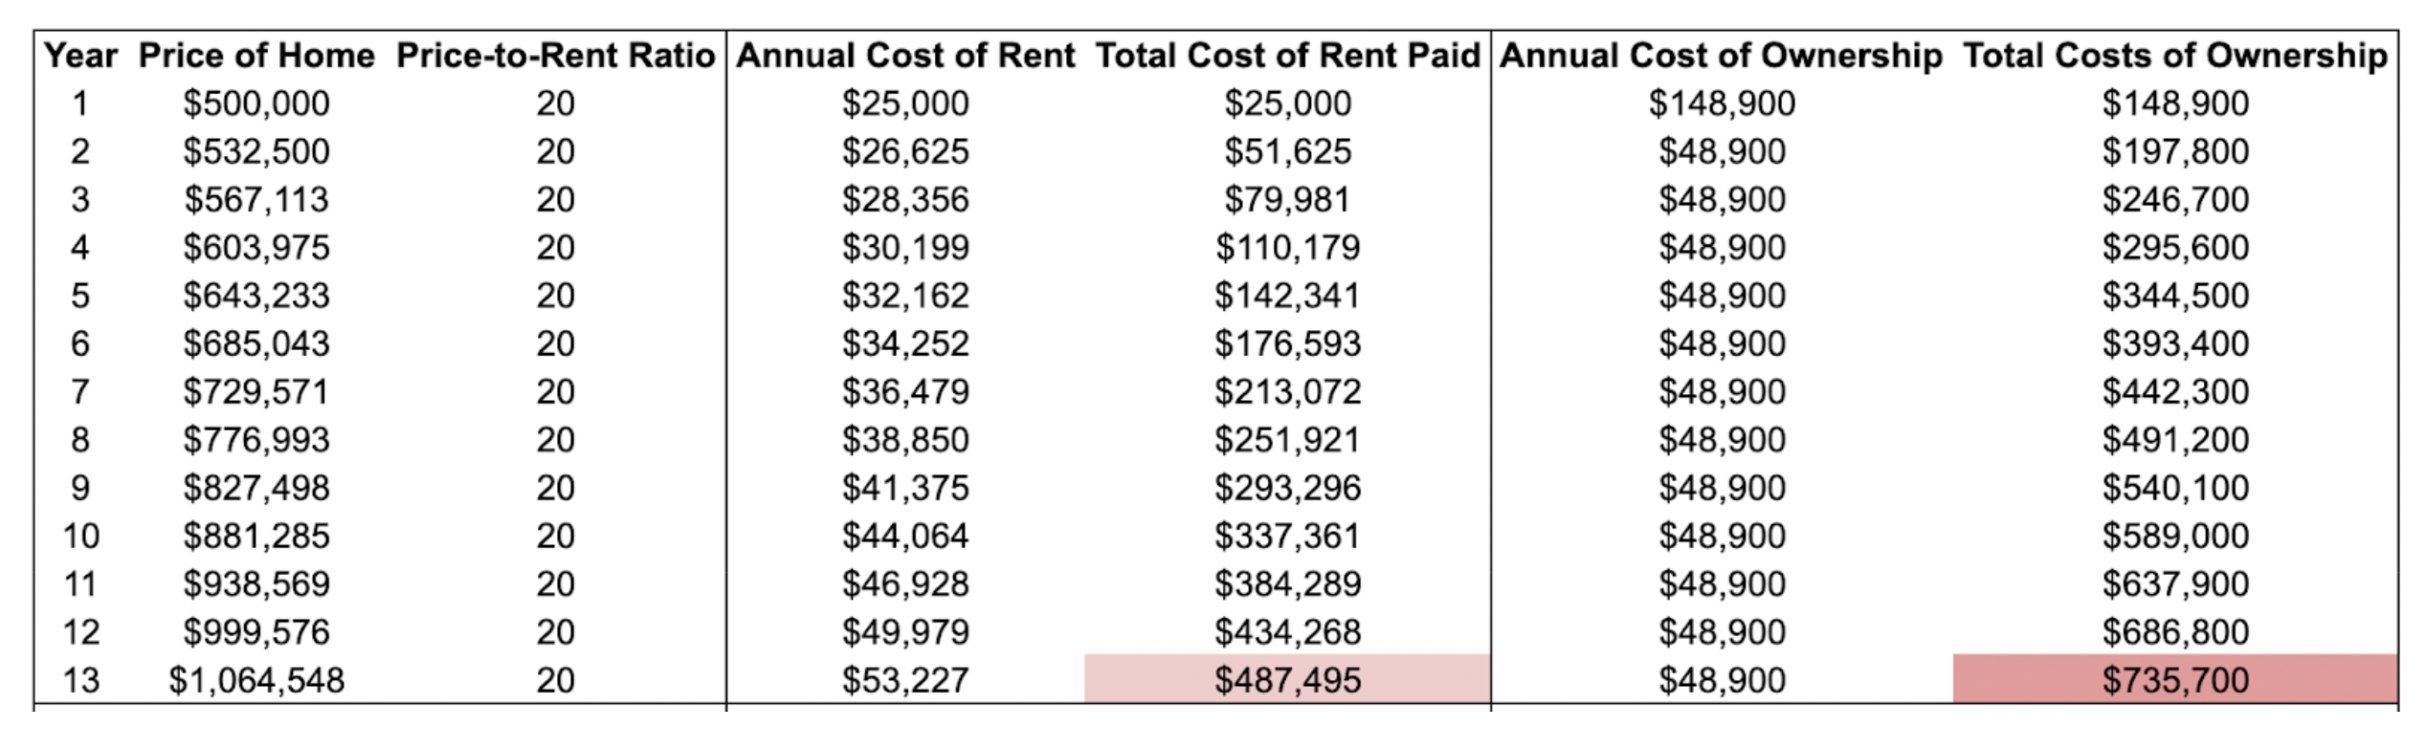
This means we could invest between as much as $123,900 in Year 1 and as little as $1,972 in Year 11. By the end of Year 13, renting would’ve produced $659,853 in investments for us, of which we’d subtract our $487,495 in costs to rent, for a net gain of $172,358. Compare this to our ownership path, where—despite our home doubling in value—we were still at a net loss of around $13,000.
It’s hard to believe renting for 13 years could come out ahead of selling a home for a million dollars, but alas, this is the magic of opportunity cost in a medium or high price-to-rent ratio area, in a world where people have other, low-cost avenues for investing their money, and can separate their need for shelter from their wealth-building aspirations.
So who got the better end of the deal? Well, it’s hard to say—though it’s far more likely that a renter would get 9% per year on their investments in the S&P 500 (the long-term historical average) than the owners would get consistent 6.5% appreciation on their home. The long-term historical average is less than 4%, though unlike the stock market, this is hyper local—some states, like California, have appreciated far above the national average.
It’s tempting on the heels of ahistorical rent jumps and housing appreciation to discredit this entire analysis, but I’d argue that’s the exact wrong approach: The last 24 months have been the exception, not the rule. Even when utilizing the tax breaks for homeowners (deducting your interest from taxable income, etc.), the difference remains, as 90% of Americans take the standard deduction since the Tax Cuts & Jobs Act raised the standard deduction in 2017. Moreover, our hypothetical capital gains—roughly $600,000 on paper—will be mostly tax-free since we lived in the home in the two years preceding its sale (we’d owe capital gains on about $100,000, likely generating a tax bill of around $20,000), while our investments in the renting scenario would be fully taxable if we withdrew them from a brokerage account all at once. But even if you assume we ignored tax planning and took the most inefficient path by withdrawing the entire sum at once, we’d pay the top 20% capital gains tax rate on all of our gains and face a tax bill of $67,174—still coming out ahead of the ownership path, since our total net gain before taxes was $172,358.
What about places with lower price-to-rent ratios?
In an area where the price-to-rent ratio is 15, renting would cost $543,876 over 13 years and we’d have $527,697 invested in the stock market, for a net loss of $16,179 (a worse outcome than the ownership path). If we use the conservative historical average appreciation of 3.7%, the net loss from ownership would be lower at -$1,122.
All that to say: Because rental markets and buyer’s markets vary so much by region, maxims like “It’s always better to rent” or “It’s always better to buy” basically never make sense. (Hell, even this example is hardly realistic, because price-to-rent ratios change over time—the chances that it would stay perfectly consistent over a 13-year period is unlikely, but the idea is that a renter could become an owner as soon as the price-to-rent ratio becomes more favorable to owning.)
Moreover, our “rent and invest” scenario assumes we’re devout investors in public markets, never missing an opportunity to shuffle our extra money into the stock market. In reality, houses act like a “forced savings device” in the sense that you must make those monthly payments (even if a pitifully small portion of those payments are actually going toward your equity). This might be partially why—in practice—homeowners’ net worths tend to be higher than renters’. Another possible explanation of this correlation? Homes don’t make people wealthy, but wealthier people tend to own homes. But they wouldn’t have to, because as you can see, a renter in an area with a price-to-rent ratio that’s roughly 20 or higher would have the opportunity to build wealth even faster than the owner of an equivalent home in their area.
I have no skin in the game in your decision to rent or buy, as I’m not a lender nor a landlord. My own objective is to consume shelter in the most financially advantageous way possible. If I lived in areas where it were more beneficial to buy a $500,000 home than to rent and invest in the stock market, I would buy a house. It just so happens that the price-to-rent ratios in my current and former cities are all >25, so I don’t—and I invest the difference.
So, when does it make sense to buy a home?
The simple answer is: When you want to, and you can afford it. The more complicated answer is: Maybe never, if you live in a high price-to-rent ratio area.
When extending our timeline to the full 30 years and using average historical appreciation instead of the ultra-aggressive rate, we would’ve spent $1.567 million as owners assuming our property taxes never went up (we know this is unlikely, but for the sake of simplicity, we’ll pretend those costs stayed static the entire time). As renters, on the other hand, we would’ve spent $1.3 million, but we’d have $3.299 million in investments. Have a look for yourself:
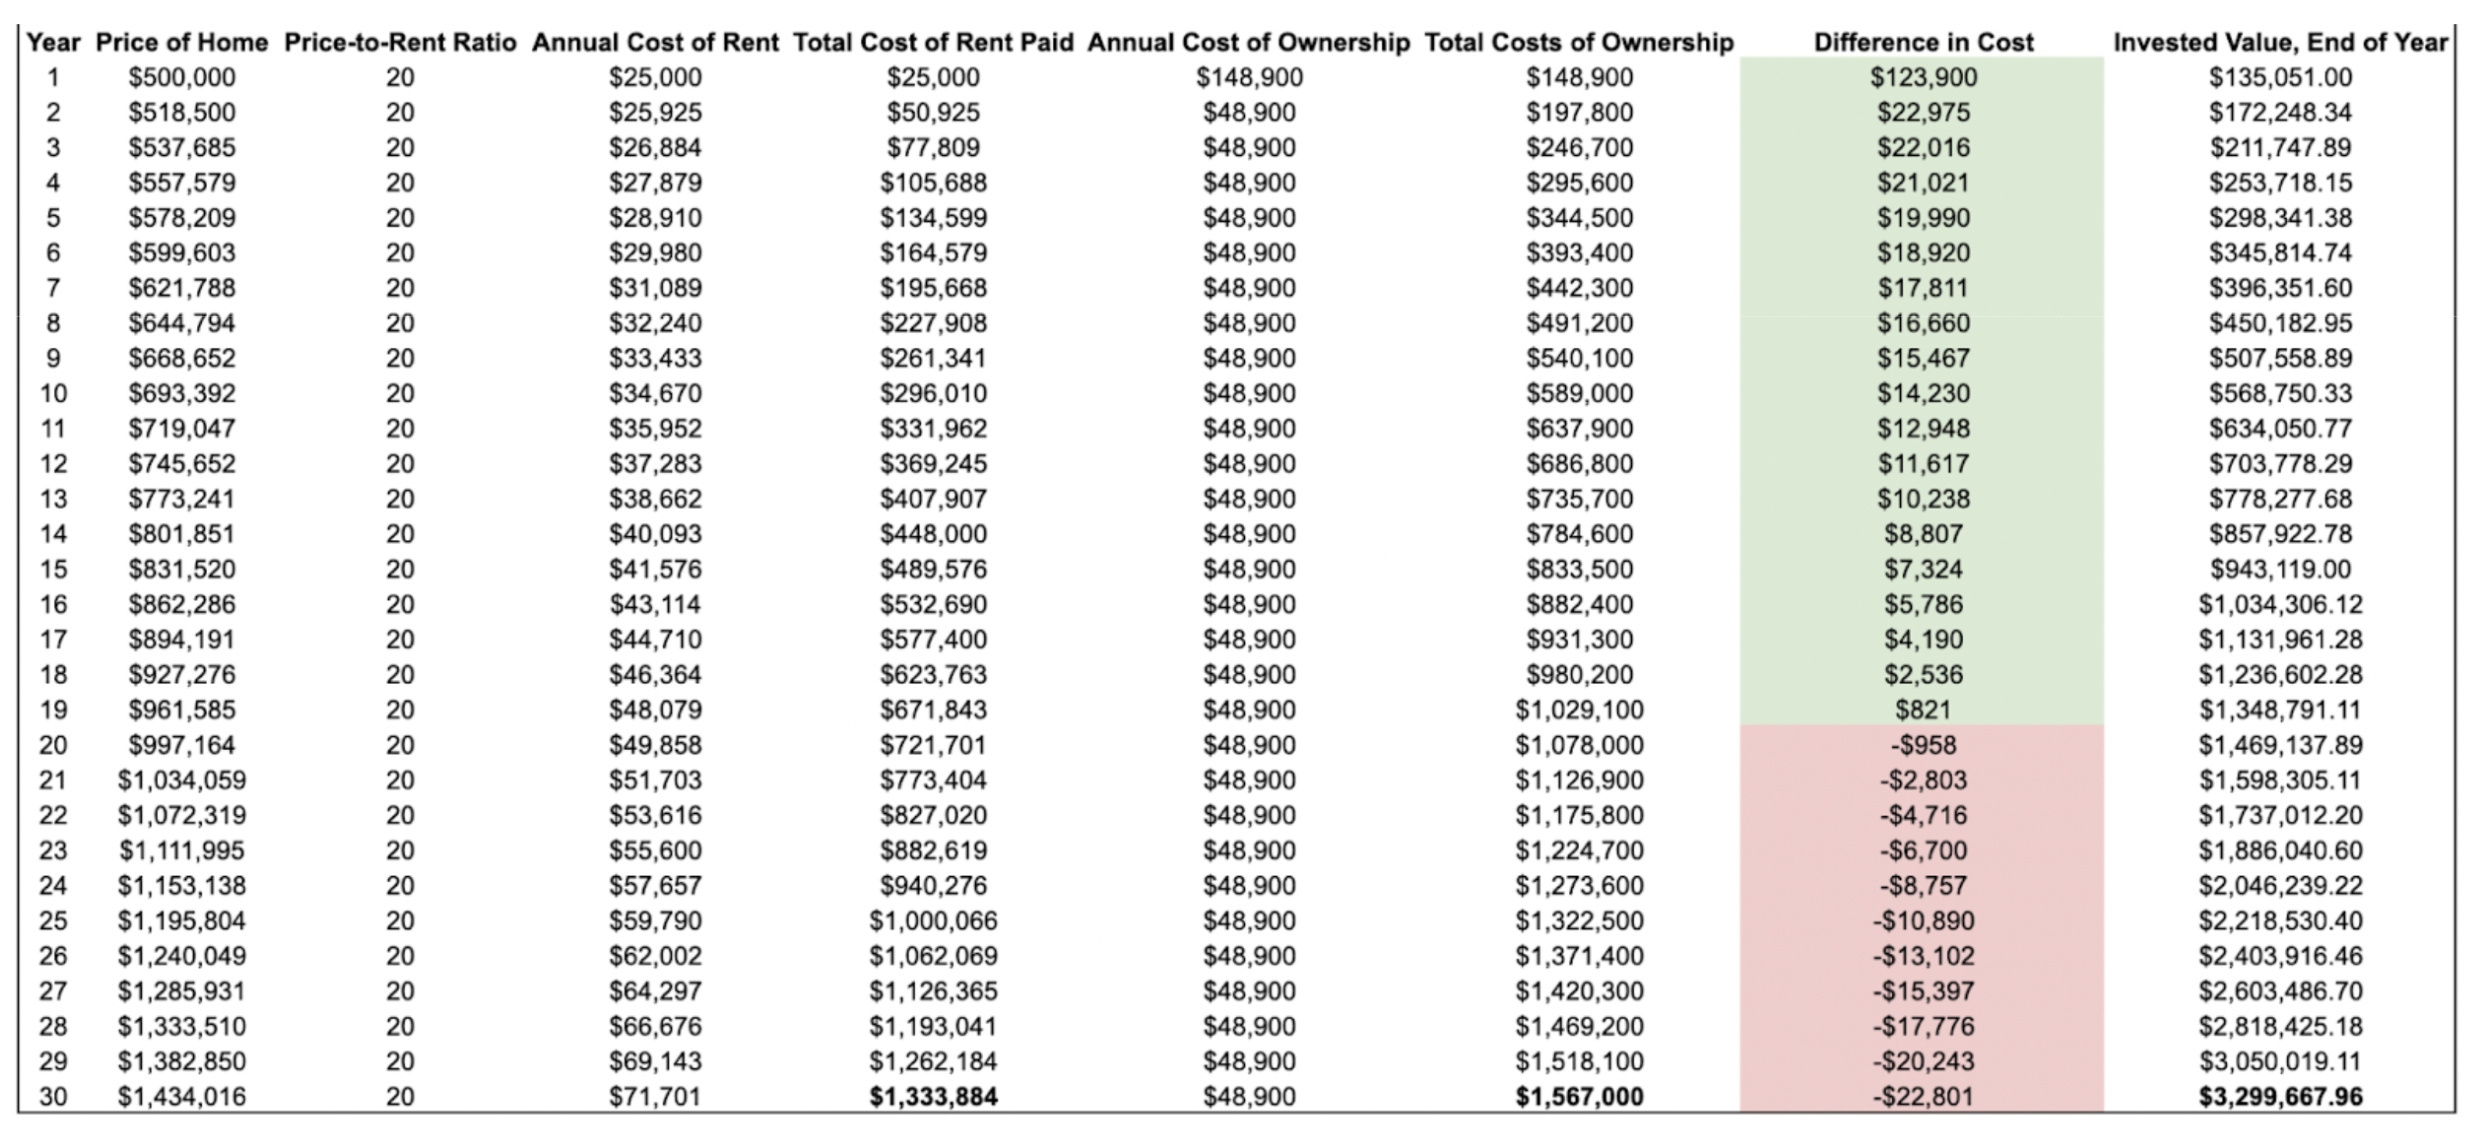
By year 30, renting puts us net-ahead by roughly $1.8 million, and ownership would mean we’d own our home free and clear (assuming we never refinanced) such that our only remaining housing costs would be insurance, property taxes, and maintenance.
Remember, it’s not like I’m suggesting starting your family of 5 in a studio apartment: Just assess the price-to-rent ratio in your area, run these projections for yourself, and consider honestly whether you’re likely to invest the difference over time. Even if you’re going to come out with a net loss, you might be happy with that if you’re really interested in long-term stability. Not every decision has to make financial sense. It’s just important to know what you’re getting yourself into when you sign the dotted line for a loan whose name translates loosely to “death pact.” We’ve been running a segment called Rich Girl Roundup for The Money with Katie Show for years and every time we put out a request for listener questions, there’s something to the effect of: Owning my home is a lot more expensive than I expected, and I miss the financial cushion that renting gave me. But these costs don’t need to come as a surprise—you can plan for them such that it’s pretty much exactly what you’re expecting.
How do you know if you can “comfortably afford” your home
If you decide you’d like to buy a house you can “comfortably afford” (whether because it makes more sense in your market, or because you’ve been cosplaying Martha Stewart since childhood and all you want in life is to be the proud recipient of a property tax bill), let’s touch quickly on what my definition of “comfortable” is: If your 20% down payment represents less than half of your total net worth and the total monthly payments (mortgage, taxes, insurance, interest, maintenance) represent less than 30% of your take-home pay every month, you can comfortably afford it. For example, in our $500,000 home example above, you’d need to have roughly $200,000 in assets total, so after your $100,000 down payment, you’d still have $100,000 left over. This is a general rule of thumb that helps avoid a situation where you’re house-poor and your entire net worth is tied up in an illiquid structure prone to plumbing issues.
Knowing that your all-in monthly payment costs would be about $4,000, you’d want to be making somewhere in the ballpark of $13,320 per month after taxes in household income in order to be considered “comfortably” affording that payment. There’s nothing comfortable about draining your savings account for the down payment and then spending half your income every month on your monthly payments (and as you can see from the prior hour of your life you spent reading this, there also might be no real financial point in doing so). In conclusion, the best time to buy a house…is when you want one, and can afford it. And as we noted earlier, with homes roughly twice as expensive in real terms as they were 40 years ago, that’s become increasingly difficult for the average American.
So let’s assume you ran these numbers for yourself and found that it does, in fact, make sense for you (financially and psychologically) to own your home. It’s time to create a process of saving for a down payment amidst your other financial responsibilities.
Planning for the expense of buying a home, one step at a time
At this point, you may be drafting your GoodReads 2-star review that simply says, “We get it, Katie, life’s expensive.” And while that’s absolutely true (and I don’t want to belittle that fact), the situation is far from hopeless. Assuming you’re saving for a home and retirement, it’s unlikely you’ll be able to manage to save and invest a lot of money for both simultaneously unless you’re part of a high-earning household and live in your parents’ basement—but with a little strategy and forethought, you can formulate a plan that allows you to make progress toward your goals simultaneously by taking advantage of their different timelines.
Step 1: Identifying your timeline
How do we ensure our eventual aspirations (the “important, but not urgent”) don’t take a permanent backseat to our more pressing desires (the “urgent, and also pretty important”)?
We’ll use a single median earner (because I don’t want to assume you’re embarking on this journey with a partner right away, or that you’ve already employed all the negotiation techniques since we wrapped up Chapter 2) living in a state with a middle-of-the-road state income tax as our example: Someone who earns $61,565 per year in a state with a 5% flat state tax. After federal, FICA, and state tax, this individual would take home roughly $4,000 per month. Let’s assume they’re 25 years old, and would like to buy a home in the next 10 years. (If you’re like, Wait a second, what if they want to buy a home in two years? Well, they have three options: Adopt some rich, generous parents, become a senior software engineer at Apple, or move to the middle of nowhere and pray for a Starlink internet connection.)
Before the life milestones begin
It might sound counterintuitive, but the best time to begin saving for retirement is technically before any of your other big life milestones happen—this has less to do with being some overachieving earlybird and more to do with how exponential compounding works. For example, in an analysis I ran for The Money with Katie Show, we found that a median-earning couple that was able to save and invest $250,000 before having children (and then lowered their save rate dramatically over the next 20 years to pay for their higher parental cost of living) was sitting on more than $1 million in their retirement accounts by the time their higher expenses lowered again.
In that sense, the time you’re likely most tempted to put the 401(k) on the backburner to focus on saving for a house is paradoxically the most valuable time to be contributing something to it. Your lifetime ROI on these contributions will be the highest (reaching a 15x return over 40 years, assuming an average 7% annualized rate of return), so we’re going to prioritize them—even if they make our intermediate term goals take a little bit longer.
For that reason, we’ll devote 10% of our income to our 401(k) right off the bat to begin the compounding snowball as early as possible.
-
$6,165 (10%) per year into the 401(k)
-
Federal income taxes: $4,958
-
FICA: $4,710
-
State: $2,632
-
Income after taxes: $49,266
-
Monthly income after taxes: $4,105
-
$4,105/mo. minus $513/mo. into our 401(k) = ~$3,600 left to work with
Step 2: Identifying your intermediate term goal amount
The tricky thing with goals that are 10+ years away is the fact that a lot can change in the intervening decade(s). For example, someone who began saving for their first home in 2000 to purchase in 2010 may have felt extremely discouraged during the housing bubble run-up of the early aughts, only to be pleasantly surprised by 2010 (close to the bottom) that their money went a really long way. Conversely, someone who began saving in 2011 (at the bottom) for a home they planned to purchase in 2021 would likely be horrified and confused by how their calculation had gone so awry.
To some extent, these things can’t really be mitigated outside of procuring a crystal ball—so instead of getting discouraged, we just need to make realistic estimates and plan accordingly. If you know where you want to buy, you can zero in on realistic historical annualized appreciation rates to calculate what a home is likely to cost in 10 years from now if averages hold steady, and assume you’ll need roughly 20% of that amount.
For example, if our median earner aimed to buy a median home ($416,000 today) in 10 years from now after a decade of average 3.7% annual appreciation, they’d be looking at a home value of roughly $534,957. Since we know closing costs usually add another ~5%, we’ll be conservative and expect to need our 20% down payment of $106,991 + 5% of the home’s value, or another $26,747: $133,738 total. (This highlights the current disconnect in median wages and median home values, as the median home value is roughly 6.6x the single median earner’s income. A median household income with two earners improves the picture, but a single earner purchasing a home on their own would almost certainly need to be a relatively high earner in order to do it quickly.) It’s possible that a lower down payment might make sense, but remember: If you’re deploying all of your savings on a down payment, you’re in a vulnerable house-poor position.
We know we have roughly 10 years to pull this off, which means we’re in a bit of a funky no-man’s-land when it comes to saving vs. investing. On one hand, if we play it safe, we know we can get average 5% returns (assuming interest rates hold steady), but we may be sacrificing much higher gains in the market. On the flip side, putting the money into the stock market might mean risking getting returns that are lower than the risk-free rate of return, thereby netting less money than you would’ve gotten otherwise had you parked it in cash with a predictable yield. The average annualized return for the S&P 500 over the last 10 years is roughly 9.48% after inflation, but there have also been 10-year periods in history where the average 10-year return was negative.
Take a look at the last 10 years of S&P 500 returns as an example of wildly they can swing from year to year:
2022: -19.44%
2021: 26.89%
2020: 16.26%
2019: 28.88%
2018: -6.24%
2017: 19.42%
2016: 9.54%
2015: -0.73%
2014: 11.39%
2013: 29.60%
2012: 13.41%
If you’re feeling uncertain about which path to choose, your hesitancy can be a sign of your risk tolerance: If the idea of sliding into year 10 with less money than you thought and continuing to rent is unbearable, the “safe and steady path” of a high-yield savings account is probably better-suited for you. But if you’re open to the idea of a different timeline (one that could be a lot sooner, or much later), you may roll the dice and invest your savings in the stock market instead. For the purposes of our example today, we’re going to use our guaranteed rates of return that we could get in a high-yield savings account (roughly 5%) because the 10-year rolling S&P 500 average returns vary so widely as to be unhelpful.
In order for us—the single median earner—to save $133,738 over 10 years while compounding at a rate of 5% per year on average, we need to set aside roughly $865 per month.
$3,600 minus $865 toward our house’s 5% high-yield savings account = $2,735 left to work with
If you’re curious, here’s a quick breakdown of what different monthly savings amount to over 10 years to give you a sense of scale:
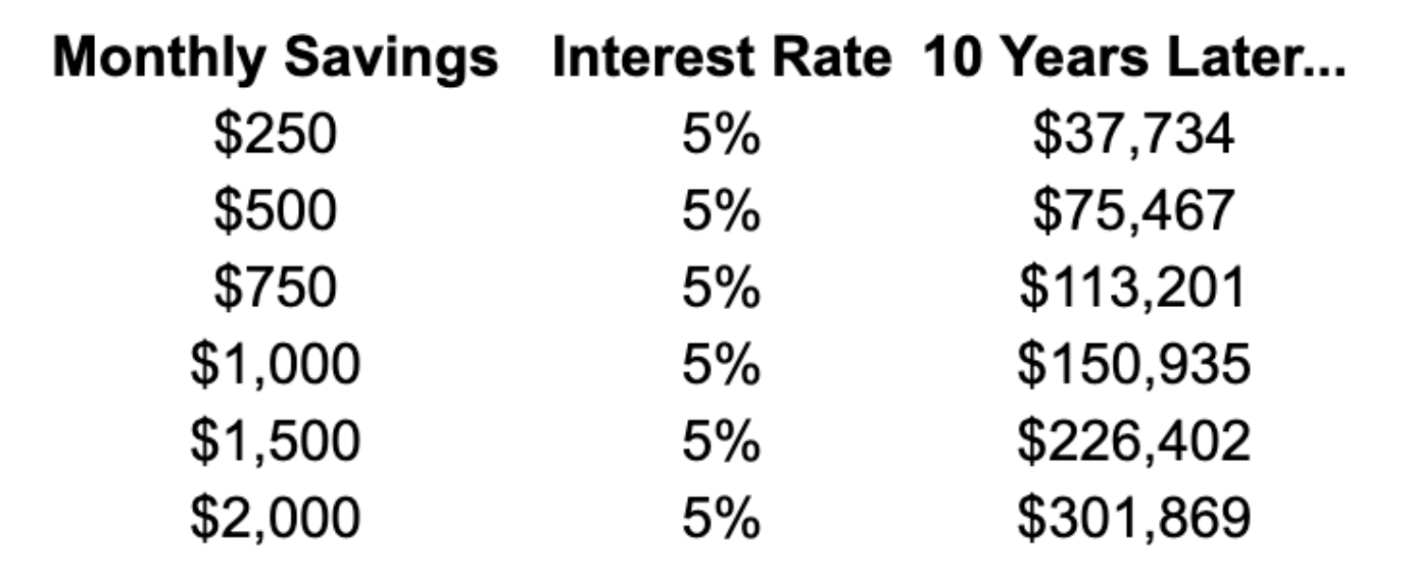
Depending on where you live, this might be plenty of money to live on or nowhere close for a single individual. So how much would you need to earn to be able to make progress toward these goals and support yourself in the meantime? If we assume average expenses for a solo Rich Girl of roughly $3,405 per month (the national average as of 2021, per NerdWallet), a pre-tax salary of roughly $75,000 would just about do the trick:
$75,000 pre-tax salary
10% into the 401(k) = $7,500
~$7,600 in federal taxes
~$5,700 in FICA taxes
~$3,200 in state taxes
= ~$49,800 after taxes and 401(k) contribution
$865/month into the house fund = $10,380 per year
= ~$39,400 to spend, or ~$3,300 per month
This emphasizes the main issue facing the single median earner today: In order to attain the “median life” on a relatively reasonable timeline, one must make approximately 23% more than the median income. (Though I suppose we should note that two individuals earning the median $60,000 per year each would make enough for this to be workable.)
In this sense, it’s technically possible to make these things happen given long enough timelines, median incomes, and really watching your expenses, but there’s very little room for error. While I wanted to show what it takes (and that it can be done) on one above-median or two median incomes, this exercise probably illustrates how far a high income (or, let’s be real, parents that help with a down payment—how roughly half of millennials end up being able to buy a home) can go.
Step 3: Seeing the bigger picture
At this point, you may be like, Wait a second, but if I’m only saving 10% for retirement through this period, that means it’ll take me 40 years to retire…how am I supposed to increase my long-term savings rate if I’m also trying to reach other financial goals? The predictable, short-term answer is earning more money and keeping your expenses (mostly) the same.
But the major benefit worth highlighting is that—in our example—your savings goal for your down payment “ends” in year 10, meaning you now have a lot more money freed up every month to shovel toward retirement (or something else). In this example, a year of house savings amounts to a little more than $10,000. When the down payment and closing costs have been deployed, that $10,000 in savings each year can be re-routed elsewhere. If it were devoted to the 401(k), this individual’s post-tax save rate would be approaching 30%.
In closing…
We cover more specifics about diversification in investments for different timelines in Chapter 6 of Rich Girl Nation, but if you opt for the more flexible “investing” route for your intermediate term goals, know that there are degrees of risk: You don’t have to go 0 to 100 and invest 100% of your money into the S&P 500—you can dial back the risk (e.g., invest 50% of your savings in the S&P 500 each month, and put the other half in a savings account yielding 5% or more).
I think this Arrested Development clip says it best:
Footnotes
-
To determine median single income household income, I downloaded the Census Bureau’s data for single-income households across all 50 states and pulled the median.
-
Taxes are calculated for the 2022–2023 tax season.
-
According to NerdWallet’s 2021 report, the average monthly expenses of a two-person household were $5,782. A household income of $120,000 in a married filing jointly household contributing 10% of their gross pay to their 401(k)s would have a monthly take-home pay of $6,876, leaving them with $1,094 available for additional goal savings.