Continue Reading
Biggest Finance Newsletter for Women
Join 200,000 other people interested in money, power, culture, and class.
Subscribe
We recently conducted a survey with the Money with Katie audience on Instagram, and the results shocked us. We had asked for a handful of economic data points, like age, location, what people spend money on, and how much their household earns. I’m not sure what we were expecting to hear, but it wasn’t this:
The median income for married couples in our data set was $217,000; the median for single earners was $119,000.
After we reviewed the results, we got on a call. “Wait,” one of our team members said, trailing off. “Are our readers…rich?” Well, it certainly appears that way for those who took the time to fill out the survey, huh?!
There’s a lot of selection bias at play, of course: This is an audience that seeks out personal finance advice, has the disposable time to fill out a survey about their money, and probably felt comfortable enough with sharing their data because they were proud of it.
Still, it made me curious enough to go poking around for data that could help me make sense of the gaping disparity between the widely reported “median income” numbers and what I was seeing within our community.
Pitying the Joneses
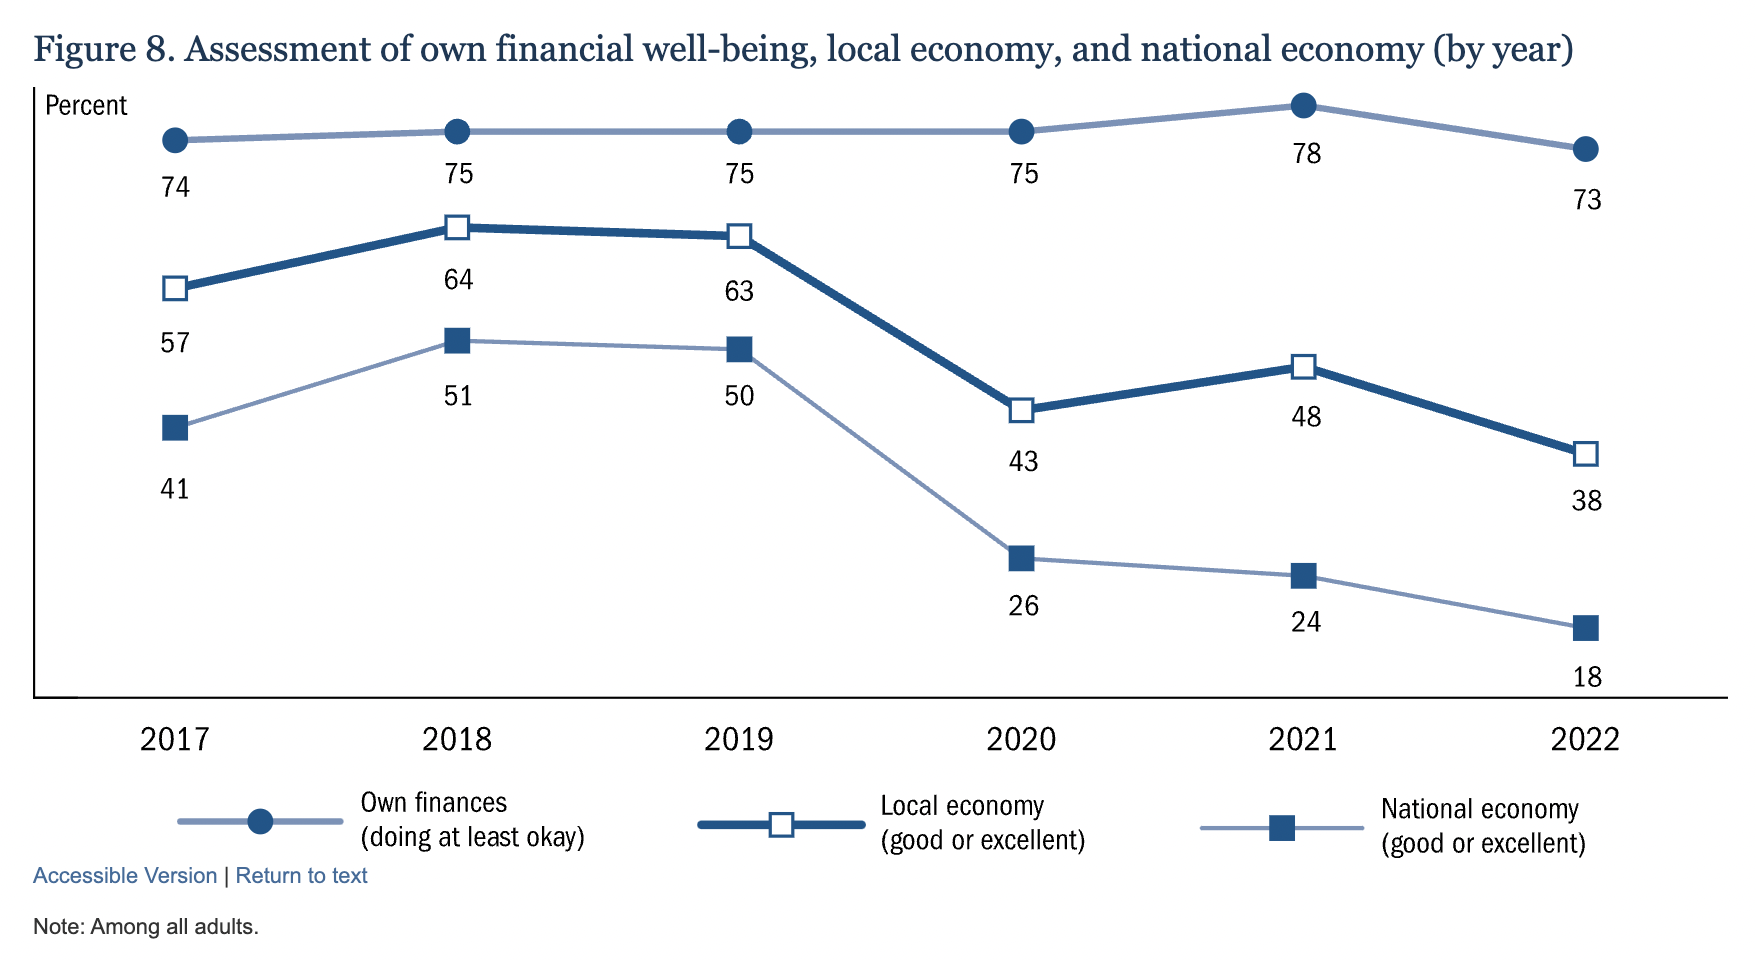
Part of the reason the results were surprising in our #CurrentEconomicEnvironment is because the general consensus across society right now is that…well, the struggle is real. Every three years, the Federal Reserve tries to understand the economic wellbeing of consumers. They ask how they’re feeling about their own finances, as well as about the state of the economy as a whole.
Here’s the weird thing: When asked how they think everyone else is doing, survey respondents were quick to tell the Fed that the economy is trash. But when asked about their own financial situation, they felt decidedly rosier. The last time people felt this “okay” about their own finances, the number of people rating the national economy as “good or excellent” was more than twice as high:

Federal Reserve (2023)
Rather than keeping up with the Joneses—admiring their shiny new Buick Lacrosse and spending our way into oblivion to win a material arms race—we feel bad for the Joneses.
>
“In short, everyone thinks the economy sucks…for everyone else.”
In short, everyone thinks the economy sucks…for everyone else.
“There’s substantial evidence that people don’t feel that they personally are doing badly. Both surveys and consumer behavior suggest, on the contrary, that while most Americans feel that they’re doing OK, they believe that the economy is doing badly, where ‘the economy’ presumably means other people,” Paul Krugman wrote for the New York Times.
Is bad data obscuring a rosier income picture?
The oft-quoted statistic for median family income in the US is somewhere in the $75,000 range. This is, obviously, troubling. It’s hard to see how anyone could afford to live a decent lifestyle (and still afford to save for the future) anywhere besides low-cost-of-living meccas, like Harlingen, Texas.
If nothing else, it certainly paints a bleak picture for laborers today. But this number is slightly misleading, because it includes elderly adults living on a fixed income (like Social Security) who are no longer working.
Perhaps unsurprisingly, things look much more encouraging when we exclude retired people. For example, in 2021, the median family income in households with two full-time earners was $130,000 (*1). [The median for a household with only one individual working full-time was $86,500. (*2)]
>
“Whatever it is, the way you tell your story online can make all the difference.”
In San Jose, California, the median household income for families with two full-time earners was $261,000. Not one of the largest 100 metro areas had a median household income below $100,000 when both individuals worked full-time.
This isn’t to belittle the economic challenges that the average American family faces. I’m aware of the obvious pushback here: the rising costs of housing, healthcare, education. I’ve covered all of these topics extensively on this site and elsewhere. Like I said: It’s not that we don’t have problems. But the income side of the labor equation is broadly underestimated, which might explain why 82% of Americans think the economy is bad.
Our own survey results fit comfortably within this data set, if slightly above average (they’d land in the top 25% of the medians listed). Of course, these are still averages and medians—which means, by definition, roughly half of people earn less than these figures. Regardless, it was nice to experience a jolt of optimism about how much people are earning.
After all, three in four Americans told the Federal Reserve they were doing “at least OK” financially at the end of 2022, consumer spending is still strong, and inflation is down to 3.2%.
While it’s important not to project our own comfort on others, the data suggests the Joneses are doing just fine.
—
1: This figure was for Grand Rapids, Michigan. The data set, which draws from the IPUMS US Census data, includes median family incomes for the 100 largest metro areas, and Grand Rapids, MI, at $130,000, was smack dab in the middle.
2: This figure was for Milwaukee, Wisconsin.
December 4, 2023
Paragraph
Looking for something?
Search all how-to, essays, and podcast episodes.
Explore
While I love diving into investing- and tax law-related data, I am not a financial professional. This is not financial advice, investing advice, or tax advice. The information on this website is for informational and recreational purposes only. Investment products discussed (ETFs, index funds, etc.) are for illustrative purposes only. It is not a recommendation to buy, sell, or otherwise transact in any of the products mentioned. Do your own due diligence. Past performance does not guarantee future returns.
Money with Katie, LLC.
Terms & Conditions | Privacy Policy
This Site Was Built by Brand Good Time


