Accounting for Inflation When Planning for Early Retirement
April 5, 2021


One of the questions that comes up a lot (both for me, and to me) is about inflation.
“Inflation” generally represents the idea that prices rise over time. This is one of the economics topics that’s right on the precipice of being in the realm of “things you need a degree from an Ivy League school” to understand, so I’m not going to purport to be an economist over the next few paragraphs–just a Non-Ivy League Economist Regular Person (NILERP) who wants to figure out how to make sure she never runs out of money.
This is an especially interesting (and relevant) time to talk about inflation, since the federal government just passed a third stimulus package, thereby giving us the $1,400 stimulus check Twitter meme format, among other things.
A stimulus package basically puts more money into circulation, and if I learned anything from Honors Economics 101, it’s that when you have more of something, it’s worth less.
The more times I read that the government is just “printing more money,” the more concerned I get – and whether or not that’s warranted probably finds its answer in history. I’m in the process of doing a deeper dive on the topic because I think historical consequences of government deficit spending can probably serve as an indication of what’ll happen post-2020/2021 COVID relief, but here’s an interesting summary I found in the NYT from April 2020:
“The CARES Act borrowing is, in many ways, the natural result of an evolution that began with the 2008 financial crisis. The bond-buying programs that central banks undertook around the world helped ensure low-cost financing for governments running giant deficits as policymakers contended with a deep recession and a prolonged period of lackluster growth. And despite constant, high-decibel warnings that such an approach would surely ignite a surge of inflation, it never happened.
That was a legitimate concern: Financial historians often point to disastrous periods when a central bank printed money for the government to pay its debts. A common example is Weimar Germany, when the central bank churned out banknotes that allowed the fragile government to repay onerous World War I reparations with essentially worthless marks, impoverishing most of the country in the process.
But at other times, the idea has worked just fine: Japan’s central bank has been buying huge chunks of the government’s bonds — effectively financing the central government of the world’s third-largest economy for years — without triggering the kind of inflation that traditional economic views would expect,” they wrote.
My takeaway? Inflation is something you definitely have to plan for, but probably can’t accurately predict
Inflation matters because it basically means your money buys less, and this is an argument I use all the time for trying to get people to ditch keeping giant sums in their piddly-ass savings accounts earning 0.1%.
2-3% inflation is normal, year over year, but it means your cash loses value over time unless it’s growing at a comparable rate. When people talk about a “real” rate of return in the stock market, they’re talking about the rate of return adjusted for inflation.
For example, if the stock market grew by 10% but inflation increased by 3%, your money did grow by 10%—but since shit costs more, it’s almost as if it only grew by 7% (10% growth minus 3% inflation).
Here’s a look at inflation over the years, from 1960 to 2021:
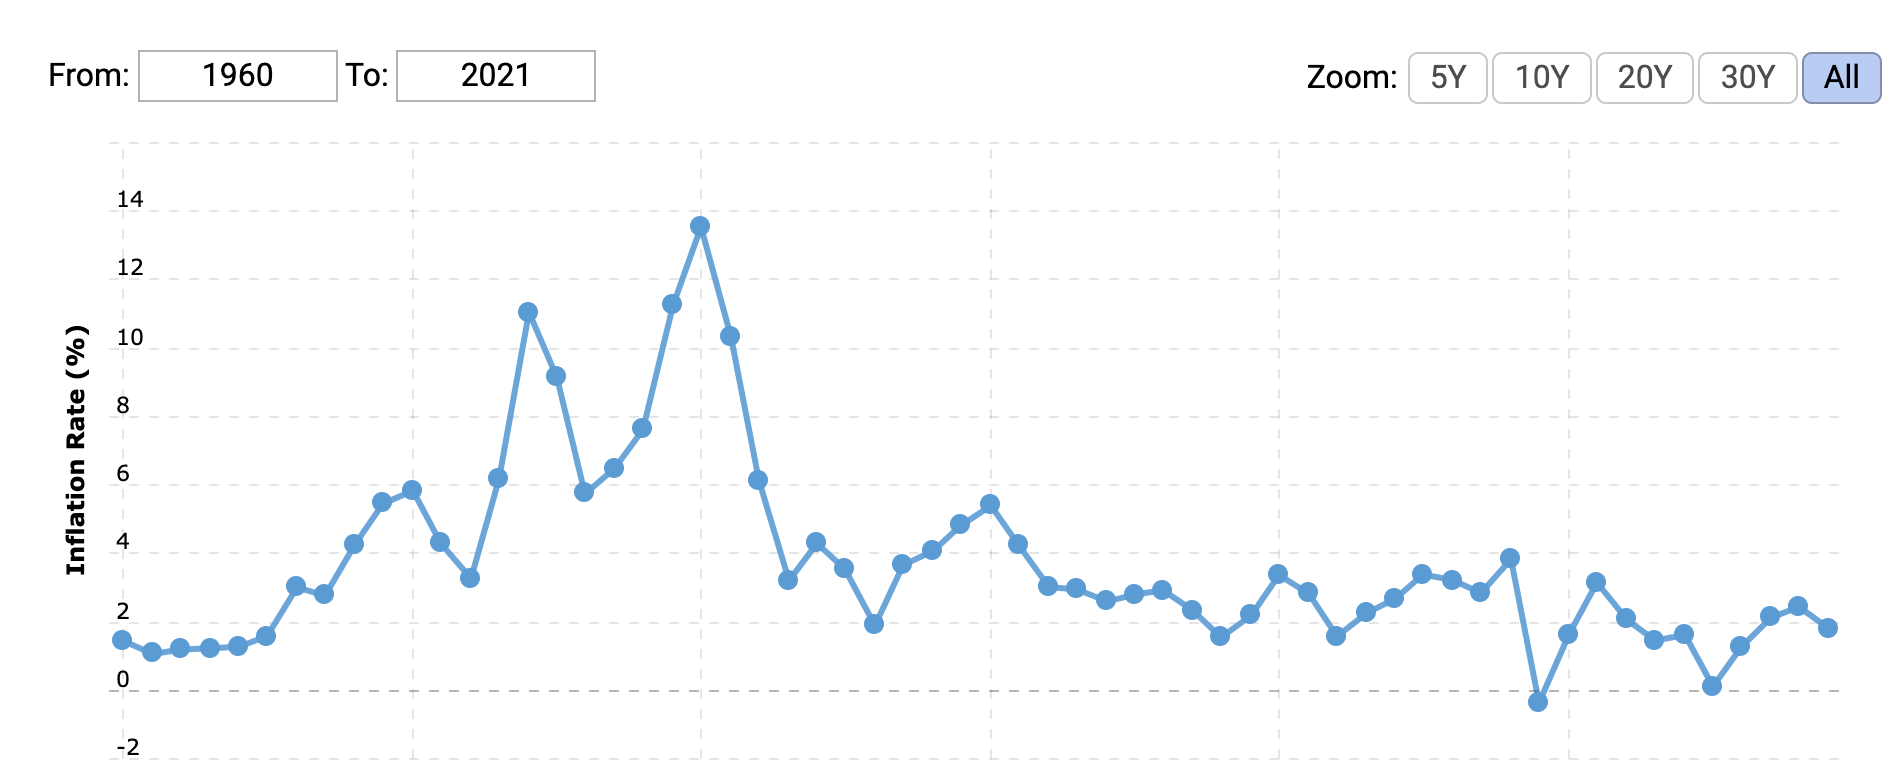
As you can see, we’ve seen relatively historic lows in the last few decades. It’s hard to know (for me, a NILERP) if the 14% inflation in the 70s and 80s was a blip or if we’re on track to repeat history now.
JL Collins wrote in his book The Simple Path to Wealth that owning stocks is a hedge against inflation because, if the price of goods goes up, so will the assets in the market that represent them, but I’m not sure that holds up in the extremes.
If you’re planning for 3% inflation and we see a decade of 6% inflation, your financial plan may not pan out as expected.
Is that a reason to throw in the towel? I don’t think so. When you’re building inflation into your drawdown strategy, there are two main ways that I like to do it.
Accounting for inflation in your early retirement plans
The government began tracking inflation a little over a hundred years ago in 1913, and since then, the average has been about 3.1%.
The S&P 500 has returned an average 10% return since its inception.
10% – 3% = 7%
7% feel familiar? That’s the average real rate of return that we often throw around, and it’s the reason why any personal finance guru who tells you to apply a 10% rate of return when forecasting is perhaps a bit too optimistic (or ignoring a big piece of the puzzle).
So if we had an average return and average inflation every single year in perpetuity, our plan would execute exactly as expected—but unfortunately, that’s not what happens.
Between the years 1926 and 2014, returns were in the 8-12% window only 6 times (per Nerdwallet). Usually, the returns are much higher. Sometimes, they are gut-wrenchingly lower. This makes it difficult to neatly forecast a drawdown strategy in a spreadsheet and map out exactly how it’ll go.
Does that mean we shouldn’t plan or try? No, but it does mean we should do so knowing that these estimates are rough, and it makes more sense to plan with a realistic (to slightly pessimistic) attitude, rather than an optimistic one.
My confidence comes from Bill Bengen’s 1994 research that was repeated and confirmed by the Trinity study. (Both of these analyses were conducted by those with more academic wherewithal than my SEC-school-attending, communications-major-wielding self.) They mapped out retirement drawdowns over every 30-year time period in the previous several decades and found that the 4% rule worked 96% of the time, historically speaking, with real inflation and real returns baked in (technically, a 4.25% withdrawal worked 96% of the time, and a flat 4% withdrawal worked 100% of the time).
(Withdrawing only 3% of your total portfolio value per year is, as JL Collins says, “as close to a guarantee as we have in this life,” which is why some really risk-averse investors will multiply their annual expenses by 33 instead of 25 to find their FI number.)
Option #1:
Keep your withdrawal rate the same as if inflation weren’t real, but estimate a 7% return. If you want to play it a little safer, estimate 6%.
Option #2:
Increase your withdrawal rate by 3% each year, but plug in a 9% return. You can go as high as 10%, but for some reason, that feels foolishly optimistic to me and I wouldn’t want to plan for that.
What does that look like in practice?
Option #1 looks like this:
-
Starting with $1,500,000, or 25x $60,000 (as if you’re spending $5,000 per month)
-
Withdrawing only $60,000 per year (in reality, you wouldn’t be, but since we’re keeping an artificially low average expected return the math should still paint an accurate-ish picture)
-
6% average market return
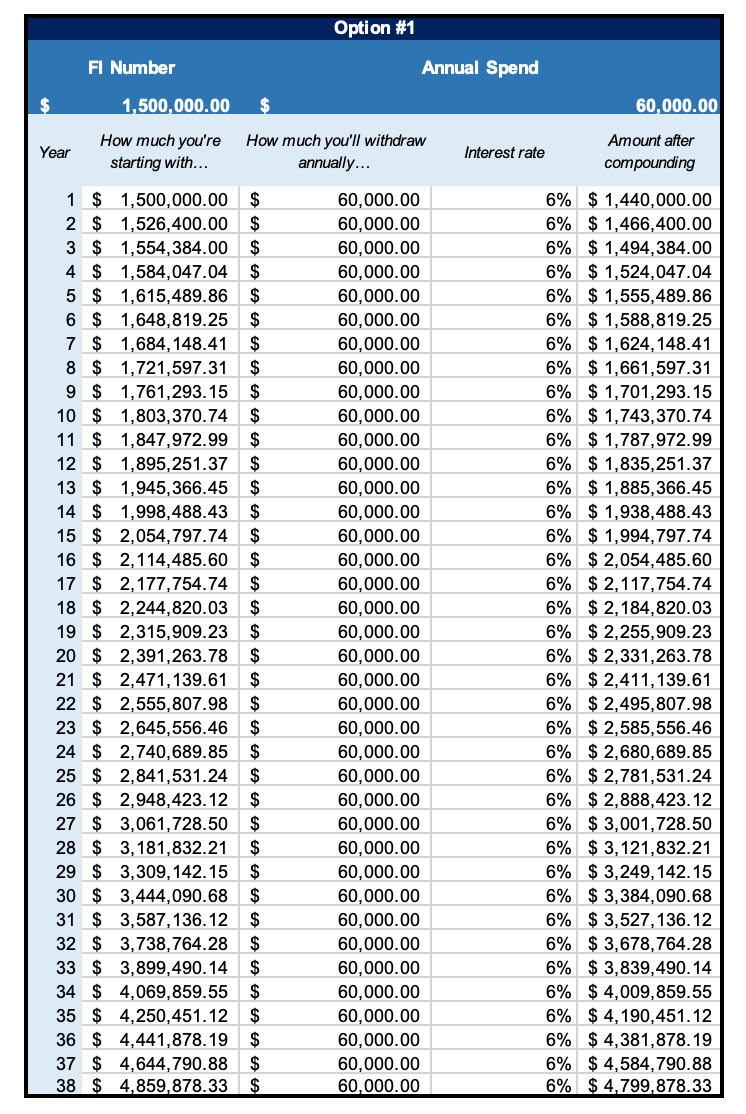
Theoretically, you’d end with $4.7M after 38 years despite your withdrawals.
Option #2 looks a bit different:
-
The same starting point, $1.5M for an intended $60,000 annual withdrawal
-
This time, we’re adjusting our withdrawal each year to increase by 3%
-
We’re using 9% as our average stock market return, a percentage point lower than the average over time
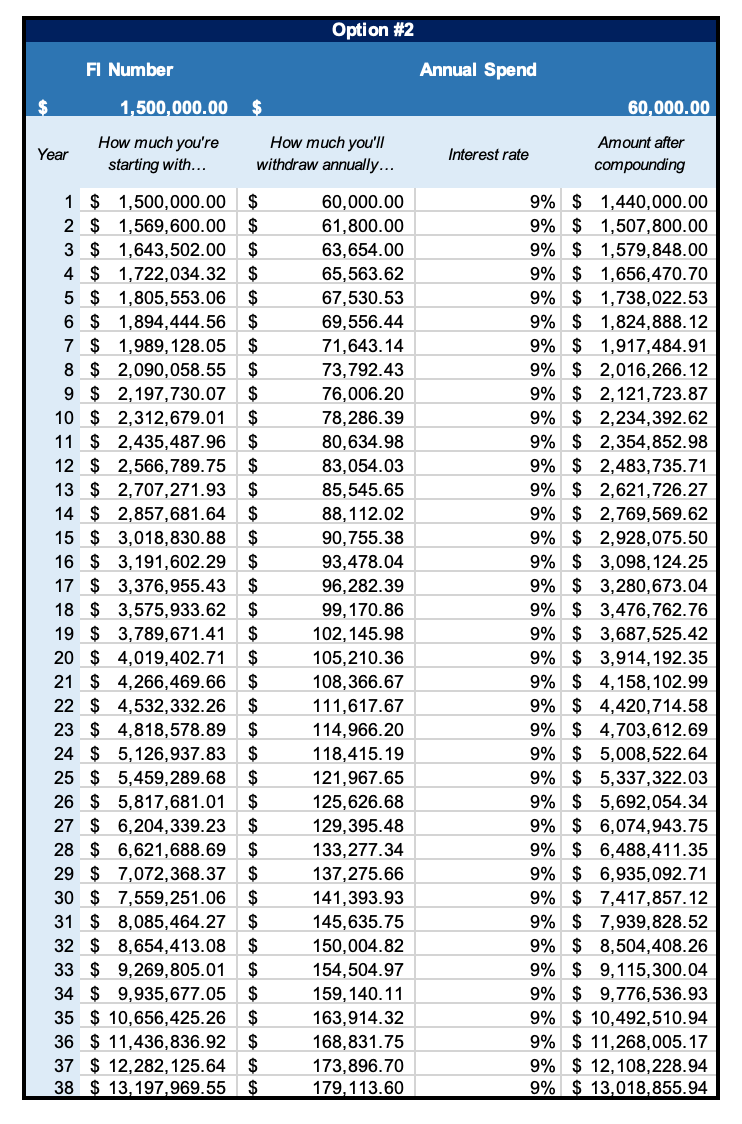
Ope – $13M? What?
If you’re paying attention, you’re probably like, wait a second—those two returns look very different.
Withdrawing 4% per year with a 6% rate of return and “0” inflation in our withdrawals turned out differently than a 4% withdrawal with 3% inflation baked in and a 9% return. Chalk it up to the law of large numbers—a compounding rate of 9% when you’re talking about millions of dollars just turns out differently than 6%.
I think baking in the inflation (by increasing the withdrawal by 3% each year) and assuming a 9% rate of return is probably the more accurate picture here, but since we’re projecting over 38 years, “accurate” is loose no matter how you look at it. Big swings in the early years of this hypothetical retirement would change the entire trajectory, for better or worse.
Lastly, I wanted to see what would happen with average 4% inflation:
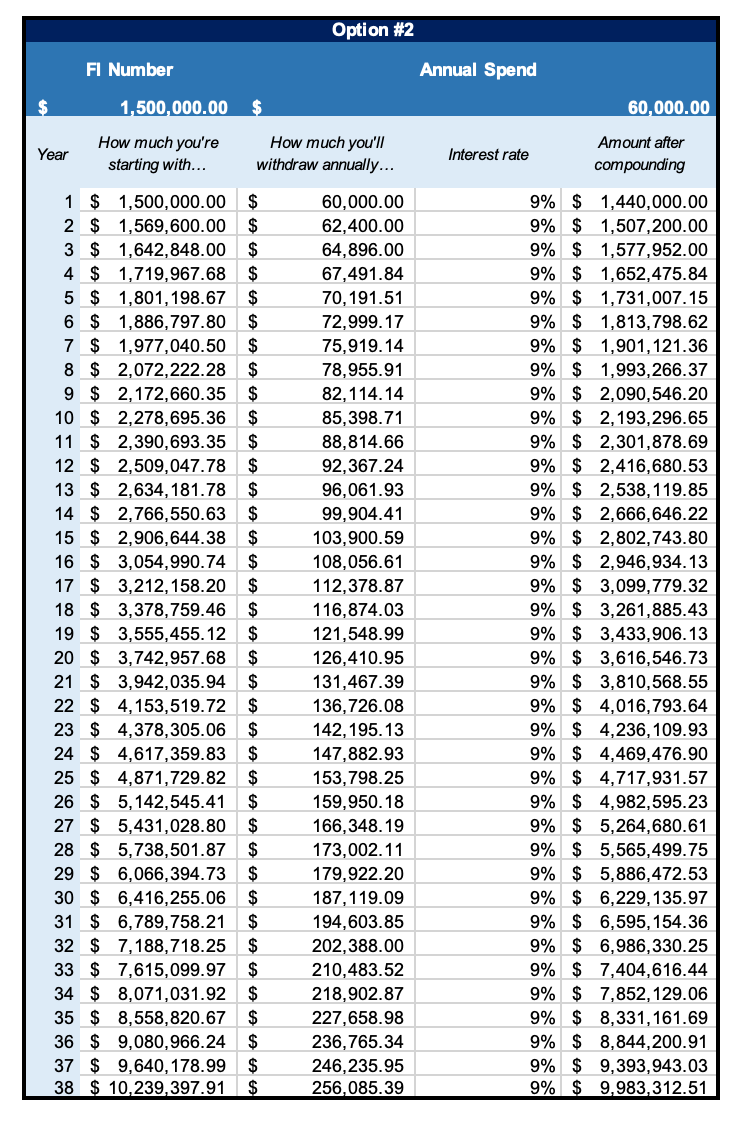
So you’ve got $9.9M after 38 years instead of $13M if inflation holds steady at 4% the entire time, as long as the stock market averages 9% per year.
To be honest, I don’t really care if I die with $4M in the bank or $13M. It doesn’t really matter to me. (And it’s worth stating here that, if you retire at 35, you probably won’t die after year 38 – you’ll be in your late seventies. But the trend established here is enough to extrapolate forward another few decades; your money is increasing.)
All that matters to me is not running out. As long as the trend line is going up, I don’t really care how fast.
When you adjust the charts above for 4% average annual inflation and an average 8% return over 38 years, you still “finish” with $4.5M at year 38, and that’s relatively comforting to me.
This is why it’s important to plan for the worst and hope for the best.
Things would have to change quite a bit (and maintain that change) over time in order for this not to work
And that’s not to say they won’t! Things could fundamentally change. There’s plenty of criticism that says history isn’t a good indication of what market returns will be later or how inflation will behave.
But we can only plan around our best estimates of the averages that we know today, looking back over the last century. Things are undoubtedly different now, and only time will tell – but this is my version of YOLO. I feel relatively confident that it’ll work, and if you don’t feel confident in 25x your annual expenses, go for 33x.
(For the $60,000 per year or $5,000 spending plan, that would be $1.5M for 25x and $1.98M for 33x – and remember, that’s not like having a salary of $60,000, because you pay taxes on your salary today. Depending on how you draw down your funds, you wouldn’t be paying any taxes on that money – so that’s a real income of $60,000 per year or $5,000 per month, not a pre-tax one.)