


The first documented mention of the term “starter home” was nearly a century ago in 1926, which described it as “for the man and wife who wants [sic] a home with comfort, but small expense.”
What do you think, man or wife? Interested in a little comfort with a small expense? Can I interest you in a vaguely sexist, small-but-mighty fortress?
A starter home is usually a 2- or 3-bedroom house under 1,400 square feet. Back in the 1940s, 70% of new houses were that size, and the median home value in the US was $2,938 (or $50,198.04 in 1945, adjusted for 2023 dollars).
The concept seemed reasonable enough, and after the second World War, a “starter home” became synonymous with the “American Dream.” (Truly a once-in-a-century marketing success for, I assume, the National Realtors Association, second only to the “diamond is forever” campaign.)
>
“The idea that you’re going to make a sizable profit or cash in for a fancier spot doesn’t really pass the historical vibe check.”
Today, only 8% of new single-family homes meet those pint-sized requirements, and the average price per square foot hovers around $150, which would mean $210,000 for a 1,400 sf. hacienda in today’s dollars (if you’re doing quick math, it’s roughly 4x more expensive).
So you might assume—by the looks of this price growth—that getting in on one of these coveted starter homes is the key to building equity and shielding yourself from greedy landlords; the pathway to your ultimate Barbie Malibu Dream House.
It’s often positioned, after all, as a way to make a profit relatively quickly: Live in your bungalow for a few years, and move on up the property ladder.
But even if you were able to snatch up a starter home at a decent price, the idea that you’re going to make a sizable profit or cash in for a fancier spot doesn’t really pass the historical vibe check.
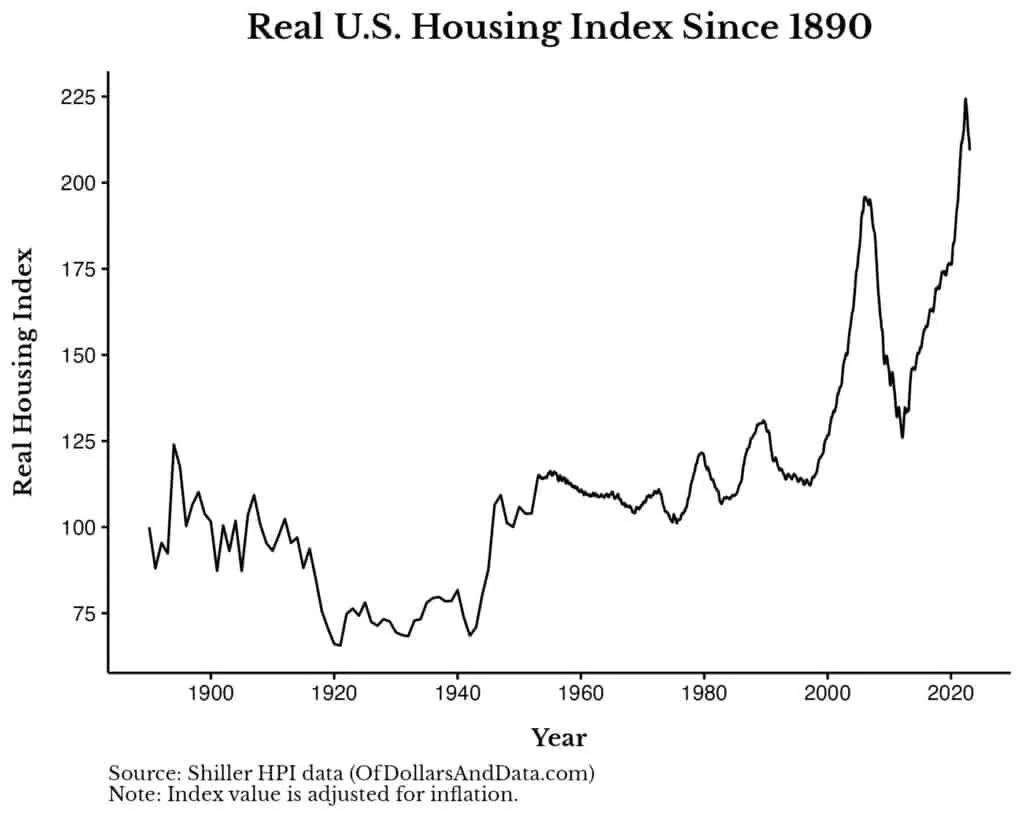
Graph Credit: Nick Maggiulli , Of Dollars and Data.
Between the end of WWII until the early aughts, US home prices appreciated by just 0.32% per year after inflation. In fact, practically all of the “real” growth in the housing index happened in the last couple of years. (The 3-year annualized returns are an ahistorical 11.49%.) If you bought in 2020 with a sub-3% interest rate right before prices exploded, you’d be forgiven for assuming you made the deal of your lifetime.
Similarly, if you bought your first home in the 1970s for a pile of gum wrappers and an expired Big Boy gift card, you’d also be forgiven for assuming that home ownership was your ticket to wealth—because while you probably didn’t see real meaningful price gains until recently, you paid a relatively cheap price of admission for shelter.
But I’ve always been skeptical about the fundamental premise of how a starter home is supposed to buoy your net worth for one simple reason: The loan amortization of a mortgage front-loads your interest payments. That is to say: In the first several years you live in a house, the payments you’re making are almost exclusively interest.
>
“In the first several years you live in a house, the payments you’re making are almost exclusively interest.”
Couple that with high transaction costs to buy and sell, and it’s a wonder anyone breaks even, let alone turns a profit that would enable them to upgrade to a nicer place. Most of the equity you have in a home you sell after five years comes from price gains on your initial down payment, but in an overpriced housing market full of 5%, 3%, or even 0% down payments (often due to financial necessity), that assumption becomes shakier.
These mathematical inconsistencies were, of course, easier to ignore when rates were low and prices were reasonable. But now? Well, don’t take my word for it. Let’s look at an example in a city reflective of our national averages.
Let’s head to the home of the Braves
Take Atlanta, a city that’s relatively in line with the average cost of living across the US. We’ll use medians where data is available, but unfortunately, in some cases we only have averages to work with.
-
The median home price in Atlanta was $350,000 as of January 2023—in line with the national median of $359,000.
-
The average five-year annualized home growth rate is 14%. This is, obviously, extreme—if we expand our lookback to look at growth between 2000 and 2020, home prices grew by 66% overall in the Atlanta area—or an average annualized growth rate over 20 years of 2.57% per year.
-
The average property tax is around 1.21% for the county (a slight uptick compared to the national average of 1.1%), or $4,235 per year on a $350,000 home.
-
The average interest rate for a 30-year mortgage across the US between 2002 and 2022 hovered around 4.82%.
-
And average closing costs fall between $7,000 and $17,500 (between 2%–5% of the home value).
If we assume you put down 20%—or $70,000—you’d take out a $280,000 mortgage.
Let’s say you have solid credit that scores you that average 4.82% rate (yes, even in this rate environment where the average 30-year fixed rate mortgage is 7.25%), the average annual homeowner insurance rate, which nets out to around $2,000 per year, no PMI or HOA fees, and—since it’s a starter home—you plan to live there for 5 years before “upgrading.”
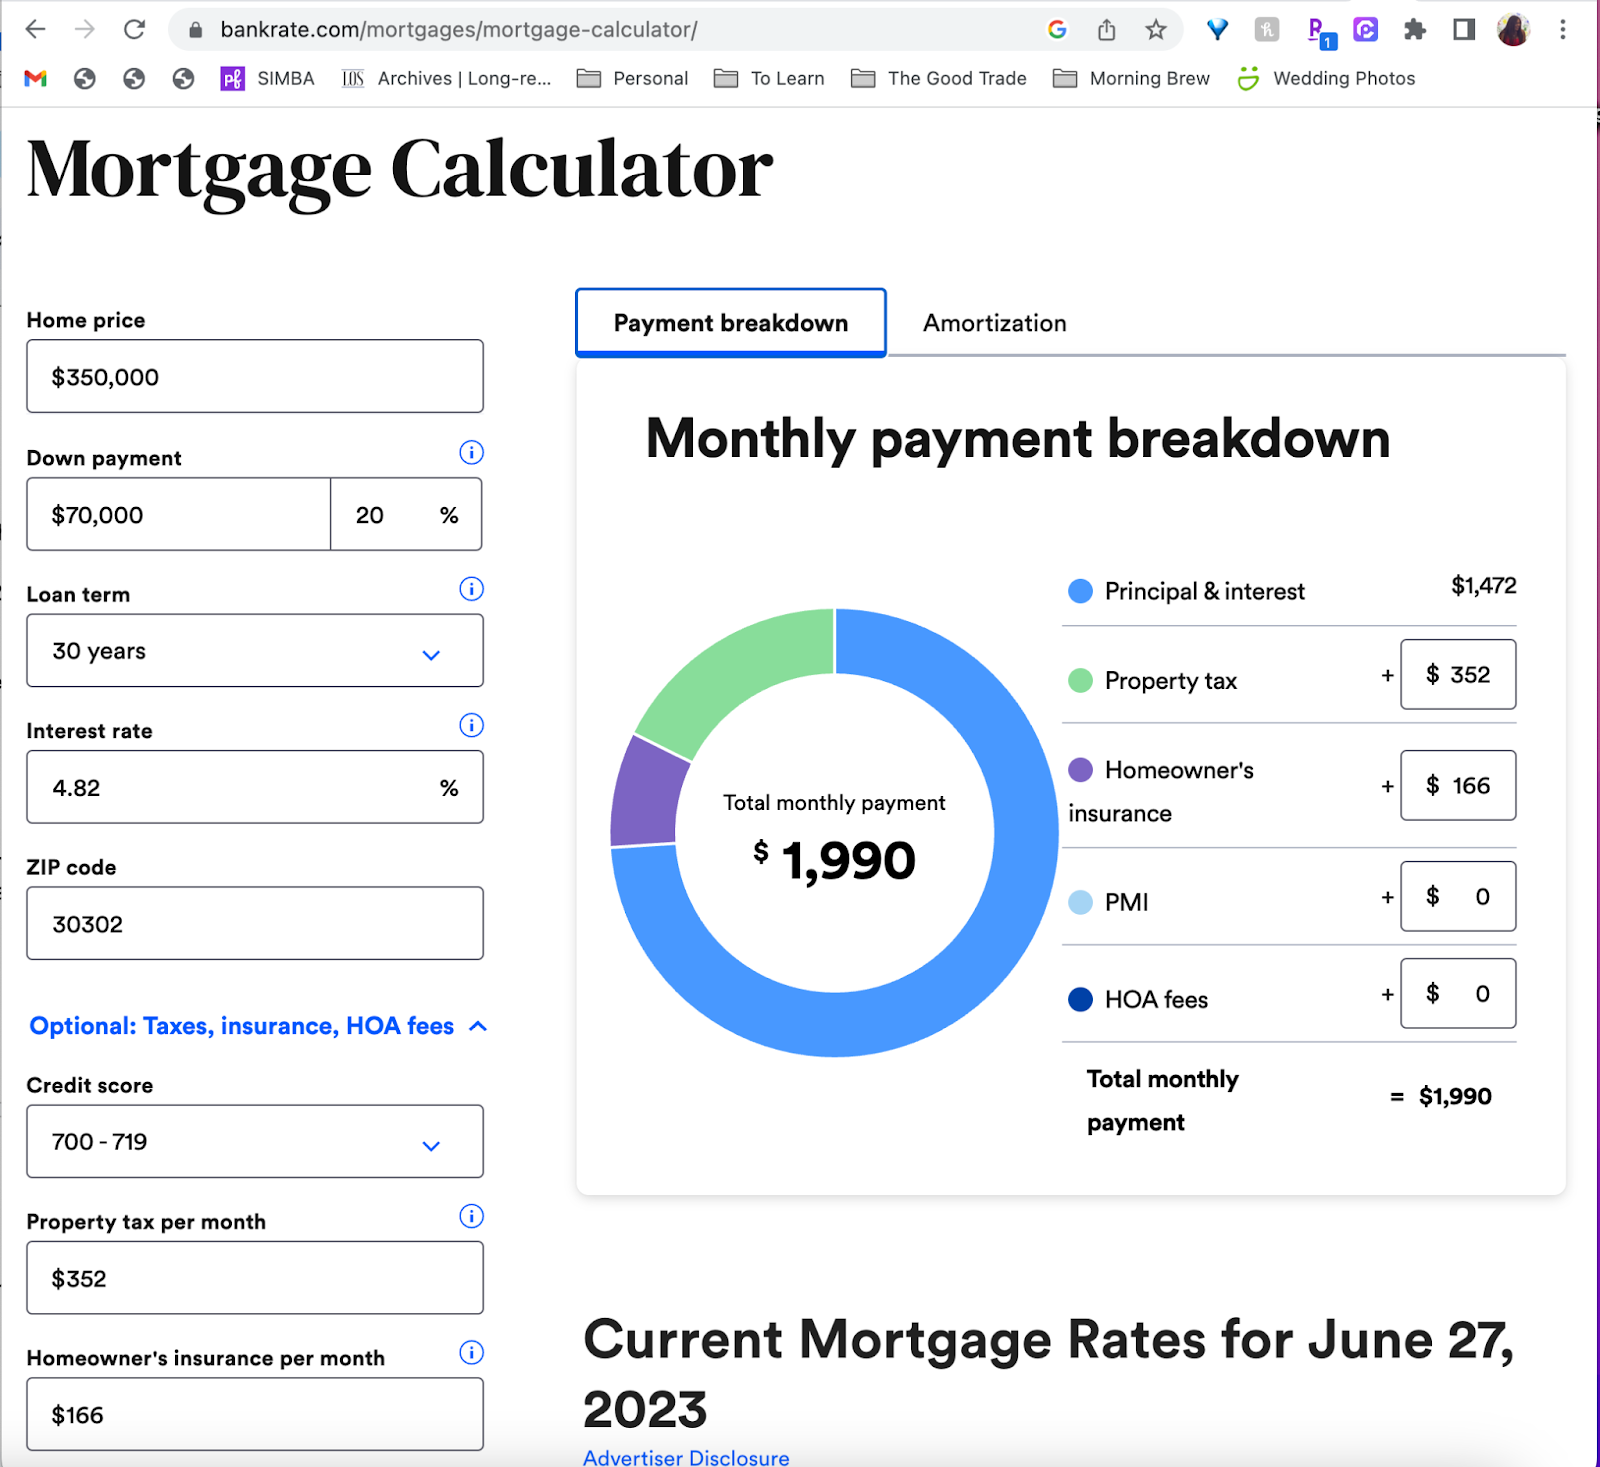
We’re looking at a monthly cost of $1,472, before property taxes and insurance. On its face, that seems manageable—but take a look at the loan servicing costs over the five years you plan to live there: $86,847.
Of your $86,847 in payments, $63,775 was just paying down interest. See below:
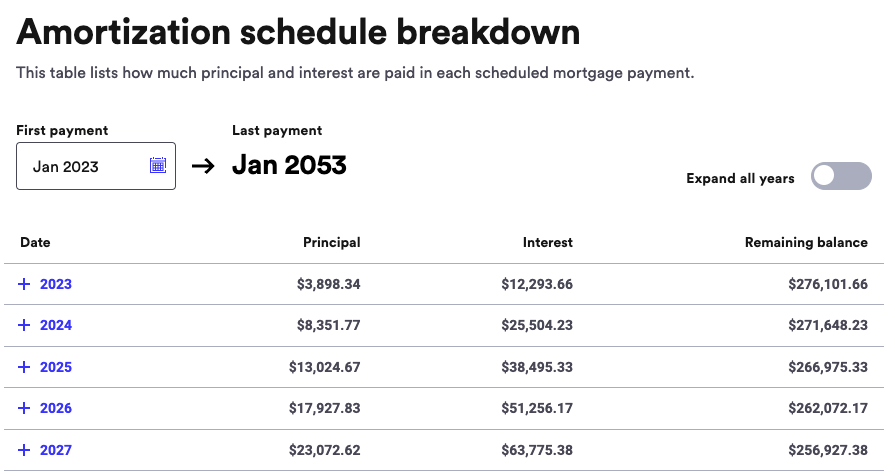
Add five years of property taxes ($21,120), insurance ($9,960), and closing costs (let’s choose the middle estimate of $12,250) plus your original down payment, and that’s a grand total cash outlay of $200,177 over five years—assuming no increases in property taxes or insurance, repairs, or maintenance.
And, of course, you still need to pay back your loan in Year 5 when you move—of which we still owe $256,927.
In order for you to break even on the $200,177 you’ve already spent and the $256,927 you still need to pay back, you’d need to net $457,104 after broker fees on your $350,000 starter home after five years.
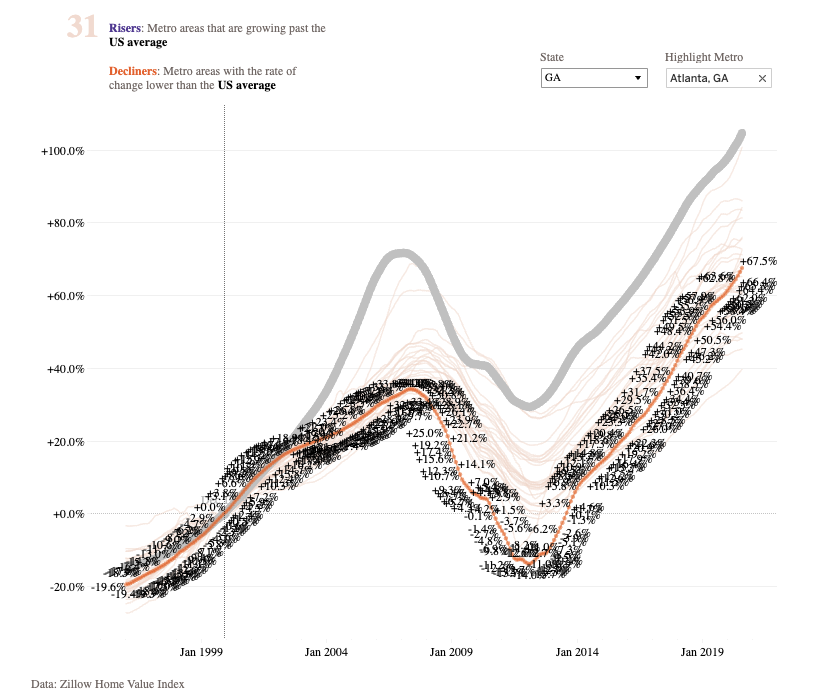
That means it would have to sell for approximately $480,000, appreciating by approximately 6.52% every year. As we know, the last 3–5 years have seen atypically high growth. And while we have an average for the previous 20 years for this area (2.57% per year), banking on any given five-year window is a gamble:
Of course, it’s important to note that your alternative—renting—will also be a cash outlay over those five years. In order to “beat” renting, you’d only need to lose less on your home sale than you would’ve lost to rent.
The price-to-rent ratio in Atlanta is around 20, which means median rent is around $17,500 per year, or around $1,458 per month (divide the median home price by the price-to-rent ratio to get annual cost of median rent), making it a metro area where buying tends to make more sense than renting, if you’re going to stay for awhile.
>
“In order to “beat” renting, you’d only need to lose less on your home sale than you would’ve lost to rent.”
Assuming your rent rises 5% per year, you’d spend $113,755 on rent over the same five-year period.
Even if you don’t recoup your entire cash outlay from your home purchase but sell at a loss less than $113,755, you’d still be coming out net-ahead as an owner.
In that respect, one could make the case that—barring any large maintenance expenses and assuming a low price-to-rent ratio like that in Atlanta—you’re still likely to lose less on owning than renting as long as prices hold steady or rise over the five years you live in the home.
And that, as we’ve learned, is little more than a matter of luck, location, and timing:

We also can’t overstate the importance of the price-to-rent ratio, on which much of this hinges: In San Francisco, the price-to-rent ratio is nearly 38, making this a totally different calculus. (Colloquially, this means the median home value in the Bay Area is 38x greater than the annual cost of renting, as opposed to 20x greater, as in Atlanta.)
The bottom line? Even though starter homes are positioned as a no-brainer to “get into the real estate market,” something you live in for a few years to make a big, fat profit and scale up, the chances that you’ll make a lot of money or even break even is, in many cases, a matter of chance—you may even lose money, but whether you’ll lose more or less than renting depends on the price-to-rent ratio and appreciation rates in your region.
TL;DR: The appreciation you’d need to see to outpace high transaction costs and interest-heavy payments in the first few years makes the “starter home for five, baller home for 10” strategy more of a compelling marketing ploy than a financial silver bullet.
Hopefully, this exercise makes you feel better prepared if you’re interested in buying someday but currently feel rushed to get into something (anything!) for the next couple of years while you bide your time.